An end-to-end implementation using location-based intelligence to conquer obstacles posed by COVID-19. Read on to understand the steps to forecast demand using regression.
Demand forecasting, in layman terms, is finding a future estimate of demand based on historical data. Forecasting is crucial to businesses as their success or failure can heavily depend upon whether they can gauge and satisfy customer* demands.
There are a variety of statistical models that can forecast the demand for a product. It is important to pick one that suits your unique business needs to reap maximum benefits. Read to understand in detail the various statistical models and how each one can integrate with your needs, their functions, their advantages as well as their limitations. Here is a detailed guide on time series forecasting using Facebook Prophet.
Demand forecasting is usually thought of as a time series problem, so why use regression to predict results when we can use the traditional ARIMA model? Can we achieve more than what time series forecasting offers? The answer is YES!
Treating demand forecasting as a regression problem makes it easy to append external factors such as socio-economic trends, demographic information, disaster statistics, etc., to the raw data set. These statistics are location-specific, for example, age-wise distribution of population in a particular zip code, COVID cases in a zip code, etc., we address these external features under the umbrella term location-based intelligence. With this approach, the model can study historical data, trends, and seasonality and consider other pandemic-imposed parameters that may be the causal factors for demand altercation. This becomes crucial now more than ever when the world is trying to adjust itself to the new normal brought on by the COVID-19 pandemic. Our model can incorporate changes caused by this unprecedented situation.
Why Clairvoyant?
Most traditional models predict the demand for a particular commodity (stock-keeping unit — SKU), while at Clairvoyant, we go a step further.
In addition to predicting demand for an SKU, Clairvoyant’s regression model can be customized to predict order quantities per SKU, per region, and per customer, offering the lowest level of granularity.Our Regression approach and location-based intelligence enable these highly granular predictions by employing one model.
Now, instead of fitting the model according to every customer, we improve model predictions by concentrating on the most important N customers. We call this the ‘hierarchical approach to demand forecasting’.This aids end-users in systematic resource allocation, inventory management, supply chain optimization, and effective decision-making. This is discussed in detail under Hierarchical Forecasting.
After identifying the object, let’s start with step one which is to study and explore the data at hand. This step is called exploratory data analysis or EDA.
Exploratory data analysis (EDA):
EDA is a form of inferential statistics; it involves systematically exploring data using visualization, data transformation, etc. It helps generate a hypothesis and make observations that assist in developing an approach to tackle the problem statement.
This initial peek helps data scientists understand what the data represents, consider the trends, identify loopholes/gaps in the dataset, and formulate their next step, i.e., data preprocessing.
For our specific objective, EDA should be carried out in two phases- the first phase with raw data and the second with augmented datasets (data enrichment).
We use EDA to answer the following questions:
-
Which are the top N SKUs?
-
Which customer orders the highest quantity?
-
Who are the customers that order the maximum number of times?
-
How does the customer-distribution look across the USA?
-
Are the time series per SKU stationary?
-
What would be the most useful features based on correlation analysis?
-
Does the data sufficiently represent the target? (PCA)
-
Does the series follow a trend and/or seasonality?
-
Which parts of the raw data are the most useful, and what can we eliminate? etc.
Data enrichment:
The core facet of our regression approach is adding external factors that influence demand and, in turn, the forecast. Our external datasets should include the following information:
-
Demographic data
-
Socio-economic information
-
Data related to pandemics and disasters
Feature engineering:
1. Temporal Features
Time-series datasets involve auto-correlation, that is, the correlation of a term with its past self. If we encounter high seasonality in the data, i.e., patterns repeating over fixed intervals, we must introduce these highly auto-correlated features into the model. For example, in the case of product demand, we may introduce features such as orders from the previous week/month/year, etc.
One may spot a high weekly autocorrelation. The following is a sample dataset's ACF (Autocorrelation Function) plot. Y-axis measures the correlation (between -1 and 1), whereas the x-axis shows the number of days, which for this plot is one month. The plot shows a high correlation between every seventh day and the zeroth day, hence the conclusion.
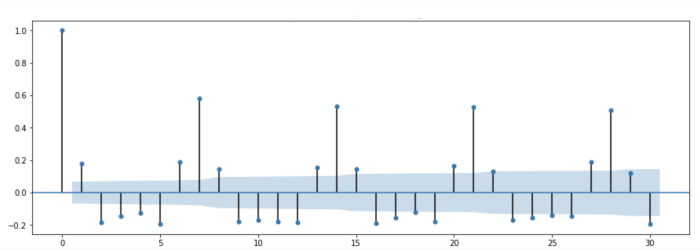 ACF Plot
Furthermore, to prevent skewed learning from a single temporal feature, we may introduce additional features to smoothen out the effect of peaks, such as prior order quantity, the order quantity of the corresponding week in the prior year, etc.
These features prove to be crucial in model-building in a demand forecasting problem.
2. Features from Augmented datasets:
As mentioned in the data enrichment section, we add location-based features such as,
-
Total population near the customer (demographic)
-
Earnings/expenditure
-
Various COVID-19 statistics
Regression:
Demand forecasting using regression falls under the umbrella of supervised learning. The models train themselves on the part of the dataset and then use the rest of the data for testing purposes. It is important to understand here that since this is a time-series dataset, we do not randomize either our train or test set and the last N data points go into testing. Test data is completely new and unseen to the model.
We use a number of algorithms to train our data and then pick the most optimum algorithm for predictions. This process is called Auto-ml.
Our homegrown AutoML platform renders predictions at the click of a button. A single click offers:
-
Data Ingestion
-
Multiple Model Building
-
Hyper-parameter Tuning
-
Feature Engineering + Predictions
For demand forecasting, we may use several tree-based algorithms. Two of which are explained below.
1. Decision Tree Regressor:
Decision trees employ a top-down, greedy search approach through the branches with no backtracking. But as we know, large deep trees, more often than not, tend to overfit, and so does Decision Tree Regressor. This holds true even while forecasting demand, and hence platform rejects this model at the behest. To learn about the crux of a Decision Tree, check out our blog here.
2. Gradient Boosting Regressor:
Gradient boosting is a machine learning technique for regression and classification problems, which produces a prediction model in the form of an ensemble of weak prediction models, typically decision trees. By taking small incremental steps towards the solution, we end up with a comparable bias but a better variance, leading to better results on the test set. This gradual learning process bears good results, and auto-ml repeatedly picks Gradient Boosting Regressor as the best model with respect to demand forecasting.
The platform also allows users to check performances with other algorithms such as Random Forest Regressor, AdaBoost Regressor, ExtraTreeRegressor, etc.
Hierarchical Forecasting:
-
How do visualizations help us develop a hierarchical approach?
Visualizations aid users in identifying the intricacies of data and understanding the business objective. In addition to that, they also assist in planning an approach to reach the objective. We use the following map-plot to understand the ordering behavior of customers across the USA. We can see that, for material, in a particular state, we have a few (say m) customers that order higher quantities than the others. Hence, we can conclude that these m customers are of higher importance. This information led us to develop a hierarchical approach for demand forecasting.
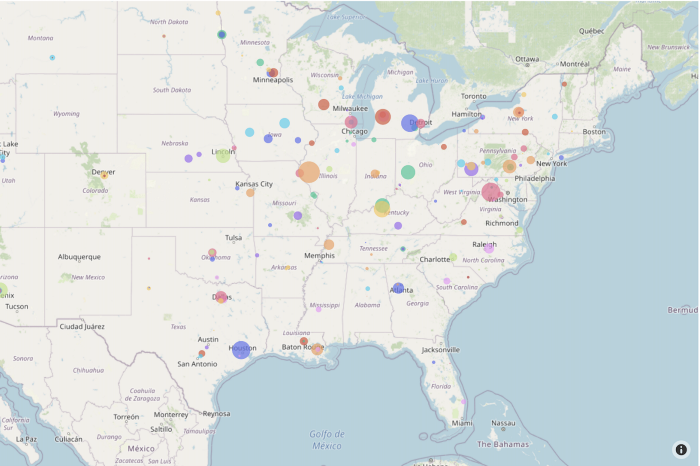 Map-plot for customer distribution across the USA
Hierarchical forecasting gives improved results instead of fitting the model to all customers. Our model custom fits itself to top m customers, per material, per state, and predicts their demand for the next N weeks. We bunch the other customers together and predict for a larger geographical area. Hence, while general models predict at SKU levels, our homegrown solution can build customer-specific demand forecasting models.
How can you do the same?
We understand that building the platform can be an exhausting and challenging task for beginners out there. Hence we recommend using Streamlit. Streamlit is an open-source python package available to build data science and machine learning dashboards. Anything and everything in it uses python. Users are not expected to know HTML, CSS, or Javascript to build large deployable dashboards on Streamlit.
One can use this package to perform all machine learning operations, such as EDA, time series analysis/forecasting, run models, visualize results, etc. The framework is highly intuitive and customizable. Plots in this blog can be recreated using Streamlit.
With Streamlit, you can build dashboards in a few hours as opposed to the conventional process that takes days. It allows users to build interactive websites, dashboards, and much more. Its compatibility and varied features make for a seamless transition from the backend to the frontend.
Summary:
As we now know, Clairvoyant’s AutoML platform efficiently ingests data, builds and optimizes multiple models, and generates accurate predictions in a single click. We also offer AutoML solutions to generate granular predictions of your product’s demand accurately. We can offer tailored data solutions to customers across all domains.
In conclusion, we can say that demand forecasting by regression renders granular results along with the superior quality of predictions. This is not a ‘one solution fits all’ approach, and the model performance also depends on the availability of external datasets, i.e., demographic, socio-economic information, etc.
This approach has many facets to itself, with time spent on every aspect to ensure quality and performance. The following is a summary of the steps followed.
-
Understanding the objective
-
Exploring raw dataset (Data Profiling)
-
Research of causal factors leading to data enrichment
-
Data cleaning/ preprocessing/ maintenance
-
Data aggregation
-
Feature engineering
-
Model building and performance optimization
-
Visualization dashboards for business verticals
[*] Note: The use of the word customer in this blog is in association with the client’s customer base unless otherwise specified.
Also check out our blog "A Guide to Forecasting Demand in the Times of COVID-19", here. To get the best artificial intelligence solutions for your business, reach out to us at Clairvoyant.