Read on for an in-depth discussion on how Prophet can be used as a forecasting procedure for different contexts on non-daily data.
COVID-19 has hampered business continuity and altered demand trends across industries. The demand patterns have been highly unsteady throughout the pandemic, which has placed several sectors in a fix.
Amidst this chaos, much like the other industries, the Consumer Packaged Goods (CPG) industry has also been trying to determine the extent of the impact this irregular shift would have on its supply chain channels and ways to optimize it. The larger question remains- How can the industry prepare itself for the post-pandemic consumer purchase patterns which will constitute its ‘new normal’?
This situation has necessitated a demand forecasting model that can recalibrate itself to adapt to such unforeseen circumstances and return to its original state when normalcy returns.
One of Clairvoyant’s CPG clients, a baked goods manufacturer, was previously working with a demand forecasting model, which was not flexible enough to adapt to the pandemic-imposed changes in demand for their products. Our client reached out to us with a need for a model that:
-
Considers holidays or special events like Valentine day, Independence day that influences demand patterns
-
Accurately forecasts weekly demands for the post- covid period
Our model was architected to make accurate predictions using a range of simple, intuitive parameters and consider the impact of custom seasonality and holiday effects. This model can be customized and replicated across a variety of industries such as FMCG, Retail, and many more.
The need for weekly forecasts arises from the client’s requirement to plan labor and raw material procurement in advance, allowing them to schedule the production on time and preserve the goods’ freshness.
Time-series Forecasting — The choice of demand forecasting method
When the demand for an item varies in the future based on the time that it occurs, time series analysis becomes an ideal method to forecast its demand with reasonable accuracy. This article will focus mainly on how we solved the demand forecasting challenge for our client using the time series forecasting framework.
When it comes to time series forecasting, we have classical methods like ARIMA, SARIMA, Exponential smoothing methods, which have been popular, but ‘Prophet’ emerged as our best bet to handle the changes in trends caused by COVID-19 in 2020 and the changing seasonality effects. The procedure’s advantage lies in its flexibility to set up the model through interpretable parameters.
Prophet helps set up an additive model that takes trends, seasonality, holiday effects, etc., into consideration to achieve a good forecast. It also allows data scientists to add other factors as regressors to improve the forecast based on domain knowledge.
y(t)= piecewise_trend(t)+seasonality(t)+holiday_effects(t)+noise
Approach
To address our client’s demand forecasting challenges, we used the time series data starting from January 2018 until the recent months of 2020. The exciting part here is how we’ve adjusted the model to get good forecasts, considering 2020 is an exceedingly strange year.
As we deal with hundreds of bakery products, not all products’ demands vary in a similar fashion. While the seasonality strongly impacts certain materials, others are less impacted by it but rather are subjected to severe fluctuations in their trends due to the pandemic effect. This situation calls for using different models accordingly to forecast the demand accurately.
We will be using snippets of the code and visualizations that convey all the information required to apply them to your time series challenges. Let us begin by setting up a model suitable for materials with strong seasonal effects. We will then move on to model optimization aspects, where we can change model parameters to achieve better forecasts in other situations.
Here we go then!
Before setting up the model, let me first show you a few handy transformations that you can make to your time-series data to get it into an appropriate shape. In our case, we had data available for the daily-ordered quantity of bakery products. The data pertains to several hundred bakery items that the client supplies to their retailers.
Let us begin by filtering the data for the item that we are going to forecast the demand for, which in this case is Cake.
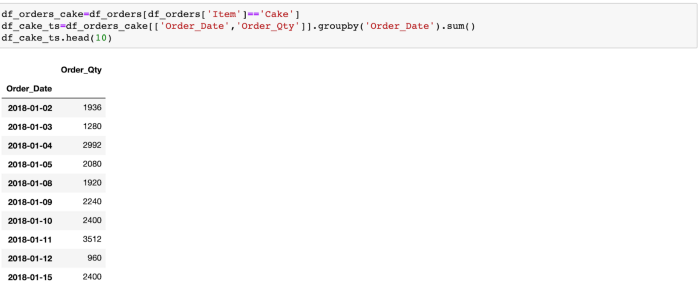
Note: Ensure that the Date column is in the Datetime format before beginning the above transformation.
In the picture above, you can see orders starting from January 2018. We are now going to convert the time series data to a weekly level as weekly forecasts allow the client to plan resource allocation at least a few weeks in advance instead of focusing on daily granularity. There might be cases where daily, monthly or quarterly forecasts are more appropriate, and that differs on a case-to-case basis.
Follow the below steps to convert the data to a weekly level:
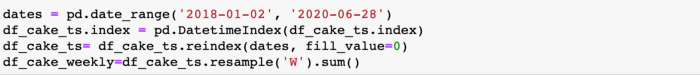
There might be a case with no orders in a particular week, but if we rely solely on the ‘orders’ data, that particular week might not feature in the time series data causing a discontinuity in the time series data. To avoid that, we define a ‘dates’ variable to cover all the days (thereby weeks) during the period of interest. Also, in some cases, aggregating by mean instead of sum makes more sense (e.g., the weekly average price of an e-commerce product)
Modeling Scenarios
SCENARIO 1: MODELLING FOR PRODUCTS WITH STRONG SEASONAL EFFECTS
Let’s kick off the first case with a few of the client’s products that experience demand fluctuations where yearly seasonality effects are strong.
The first step in setting up the prophet model is to have the time series data frame, where the date column should be named as ‘ds’, and the value column that is going to be forecasted needs to be titled ‘y’.
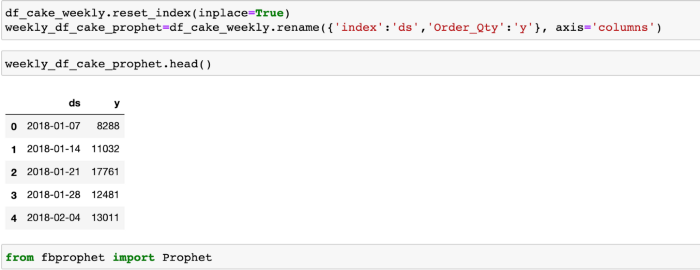
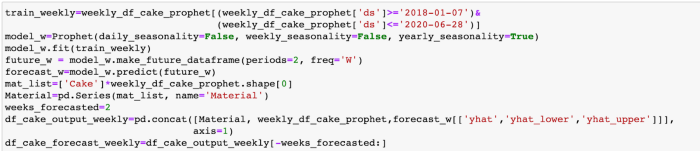
Import the Prophet module from the FB Prophet library. Here, we have the training dataset from January 2018 to the 28th of June, 2020, and then we go on to instantiate the Prophet object with yearly seasonality switched on. Weekly seasonality has been turned off here as the training data is at a weekly level, and there is no scope to determine how the value varies within the days of the week.
The trend growth, by default, is given as a linear function. You can change it to a ‘logistic’ curve if you think there is a limit to the growth of the item’s value in the future. Also, the yearly seasonality fit here is in additive mode by default, which implies that seasonality components are added to the same effect no matter the trend variation. If you notice that the seasonality components vary differently as the trend changes, then the seasonality mode can be multiplicative.
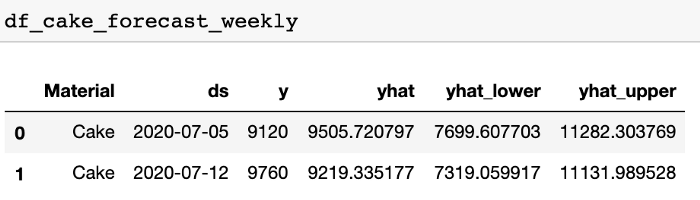
As we are going to forecast for two weeks after the 28th of June, 2020, we define a dataframe called future_w where two weeks are added to training data resulting in a dataframe starting from the first week of January 2018 until the second week of July, 2020. Note that this dataframe has a timestamp starting from the beginning of the first week of training data until the last week used for forecasting. We use the model we defined earlier to predict this dataset. The ‘forecast_w’ dataframe has model predictions, including values of the trend, seasonality components, etc. We only subset the required columns such as ‘yhat’ (prediction), ‘yhat_lower’, and ‘yhat_upper’, which are the uncertainty intervals of the forecast (width of intervals by default is 80%, you can change it to 95% or other values using the interval width argument while instantiating the model). We concat that with Material and actual values to get a data frame that allows for comparison of actual (‘y’) vs. predicted values (‘yhat’). Below, you can see the dataframe that shows the forecasts for the first 2 weeks of July that we tested for.
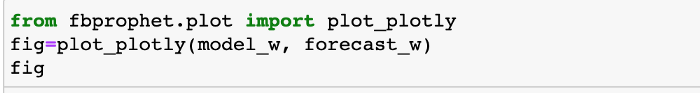
Prophet also allows us to build great visualizations using the Plotly package. The code snippet and plot generated can be seen below. You can see below, the plot for the entire duration of the data we have and only for the last 1 year of it just underneath it. You can use the buttons on the top of the slider below to adjust the view of the duration you want to view. Actual values are plotted as black dots, predictions are on the blue line, and the light blue background represents the uncertainty intervals of the forecasts made by ‘Prophet’.
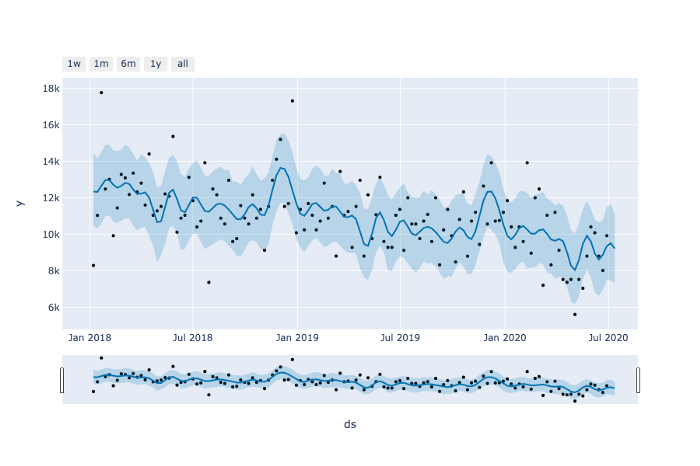 Time series plot for the entire duration of the data
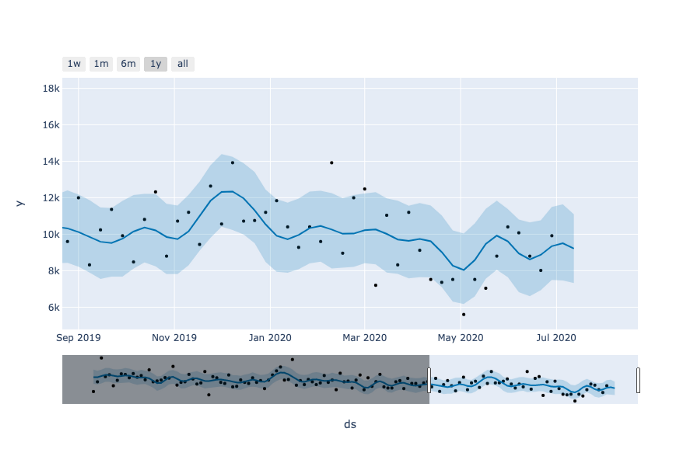 Using the slider to zoom in the last one year period
SCENARIO 2: MODELLING FOR PRODUCTS WITH SIGNIFICANT TREND
FLUCTUATIONS/HOLIDAY EFFECTS TO THEIR DEMAND
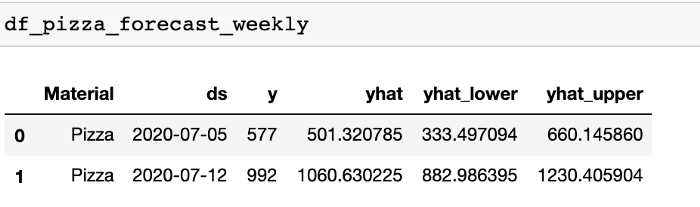
Here, we will be dealing with one of the client’s major product categories, Pizza. Its demand took a hit during the initial months of the pandemic, i.e. March and April, when the Covid effects were severe, accompanied by the initial wave of the economic downturn in the U.S.
When conditions started to ease around May, the demand for products like Pizza spiked, especially during celebratory events/holidays such as Father’s day and Independence day.
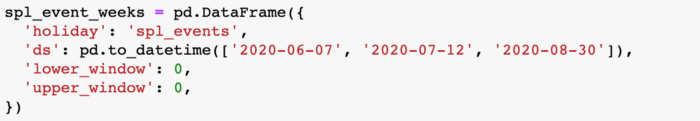
So, in this case, we have also created a dataframe that indicates whether a particular week has a special event/holiday effect in it. In our case, based on our domain knowledge, we’ve concluded that orders from retail customers have increased around 2 weeks before Father’s Day, which fell on June 21, 2020. We can see a peak in the orders for the week ending on June 7th, 2020, and we expected the orders to peak again in the week following Independence day, which fell on Saturday (July 4th) as retailers wanted to replenish the stock that sold out in the earlier weeks.
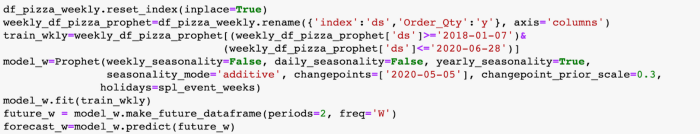
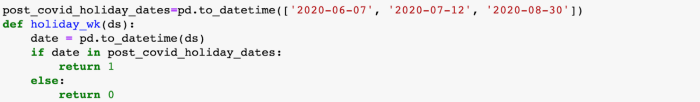
Once the dataframe is created, the holiday effects are passed through the holiday argument while instantiating the Prophet object. So, we specify the week ending on July 12 as a week likely to see the holiday effect. We also have a week ending on 30th August included in the holiday dates as this week (24th -30th August) is expected to witness a spike due to Labor Day falling two weeks later.
In addition to that, we can manually specify the trend change point at the start of May. Give a change_point_prior scale to it so that the new trend is picked up from that point onwards. The default changepoint prior scale used in the first model is 0.05; we have increased it to 0.3 for our case. By doing this, we are asking the model to be more flexible in adapting to the new trend starting from May 2020.
This is a great feature in Prophet, where if we are not satisfied with our first model, we can inject our domain knowledge by adding specific parameters to the model.
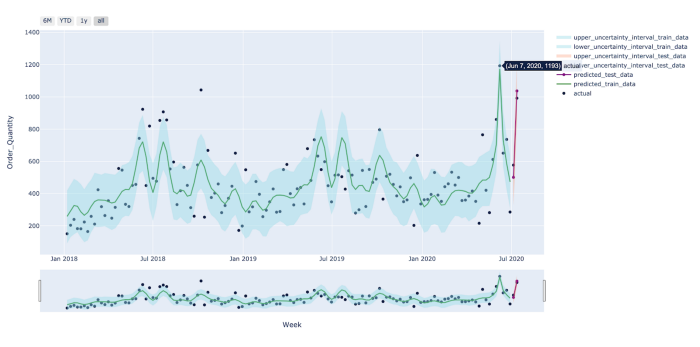 Notice the peak on June 7th, 2020
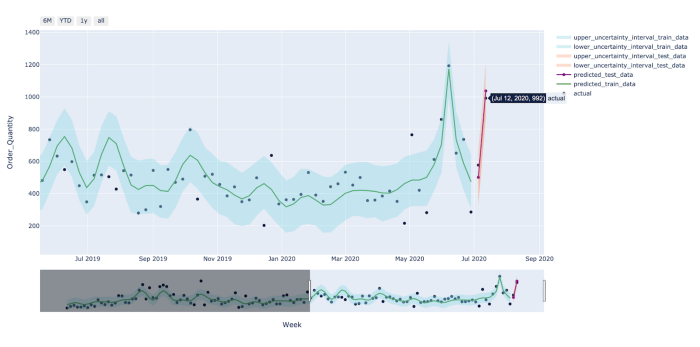 Notice how close the predictions are to the actual values in the orange shaded area after taking holiday effects and trend changepoints into consideration.
By now, we’ve seen that the model can predict demand for certain holidays. But how do we determine which weeks will be impacted by the holidays? Human analysts may not be able to track every single holiday fluctuation, but a well-trained and efficient demand forecasting model can. Clairvoyant’s time series demand forecasting model can automatically detect the weeks that will experience spikes and the others that are likely to go through a lull.
SCENARIO 3: SETTING UP THE MODEL, SO THAT TREND CHANGE POINTS ARE
DETECTED AUTOMATICALLY AND ALSO CONSIDER ADDITIONAL REGRESSORS
Prophet can by itself automatically detect potential changepoints, if you don’t specify any manually. By default, the changepoints are taken from the first 80% of the time-series data used for the training. In this case, we would be changing it to the first 90% as we want the model to capture the latest trend changes due to COVID effects in recent months for this particular material.
Another thing that distinguishes this case from the previous one is the addition of holiday effects through a regressor. Since Prophet works as a regression model, you have the flexibility to add additional regressors if you know your industry well. Ensure that this additional regressor has known values for the historical and future dates you are forecasting. If you don’t know the future value, you can forecast it separately and then include it in the regressor.
Adding holiday effects through a regressor will have a very similar effect as the method used above for introducing holiday effects. Instead of a holiday week, you can pass any other time-related feature that can be relevant to your forecasts as a regressor.
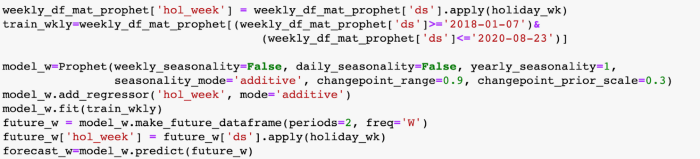
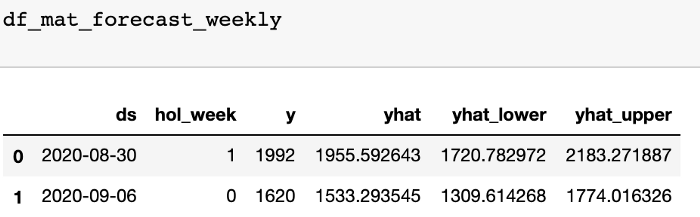
Here, we have reduced the yearly seasonality Fourier order to 1; by default, it is 10. This keeps the curve from overfitting to every fluctuation and instead results in a smoother fit. Then, we gave the change point prior scale and added holiday effects as a regressor. First, we add the column ‘hol_week’ to the main dataframe and do the same with the ‘future_w’ dataframe. Now we can predict just as we did before, but the training data here is from January 2018 to August 23, 2020, and the forecasted weeks are 30th August 2020 and 6th September 2020.
Predictions are shown below:
This time, we are also showing the changepoints added to the output plot, and components given by Prophet.
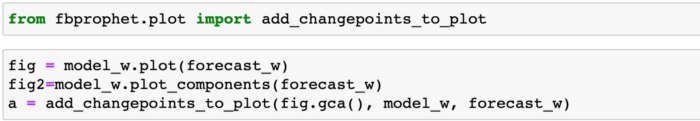
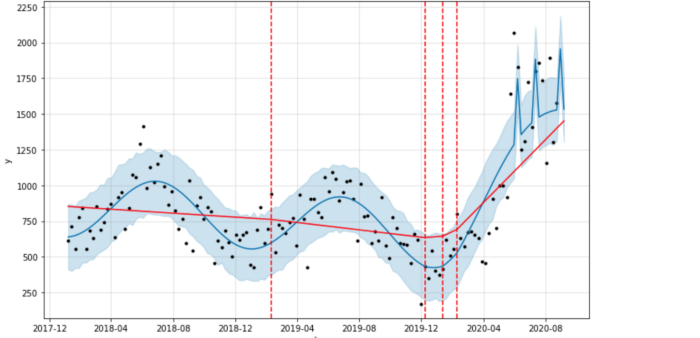 changepoints added to the plot
Components
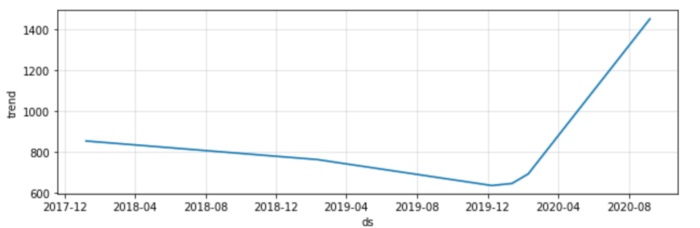 Trend Component
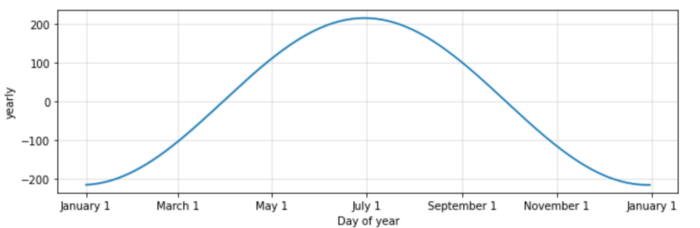 Yearly Seasonality Component
 Holiday week regressor effect component
You can see how ‘Prophet’ is detecting the trend changes in the trend plot, and how the demand varies within a year in the yearly seasonality plot. The last plot shows the effect of the holiday_wk regressor. In this case, we have only added holidays starting from June 2020 because we saw that the holiday effects in the previous and current years are not the same. So, we didn’t specify holidays from the previous years as we don’t want the model to learn from those examples.
SCENARIO 4: PRODUCTS THAT HAVE CUSTOM SEASONALITY EFFECTS
Until now, we’ve predicted the weekly demand considering yearly seasonality only. In the fourth case, we will be dealing with product categories that have a custom seasonality effect. While Prophet allows for daily/weekly/yearly seasonalities by passing relevant arguments, there might be cases where you want to add additional seasonality effects like quarterly/monthly seasonalities.
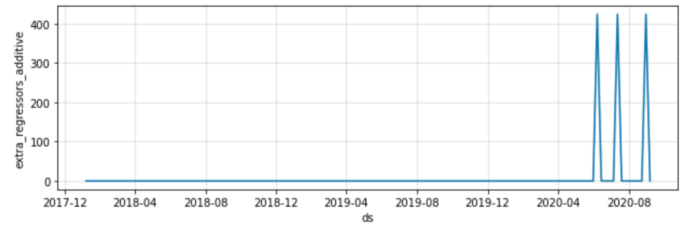
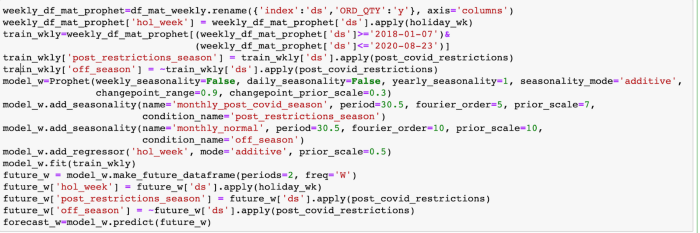
You can add a custom seasonality in such cases as in the example shown below. Here, we add a monthly seasonality to the model defined earlier. Note that the period is always given in days (inside the ‘add_seasonality’ method), even with weekly forecasts.
We have also defined two windows here (added new columns to the train dataframe and future_w data frame indicating these windows); one window caters to the time when COVID restrictions started to ease, and the surge in demand from then on had a different monthly seasonality strength compared to the other window catering to the normal situation. In your case, you may or may not need to define two windows to use the custom monthly seasonality; one might be enough for the entire duration of time studied.

Finally, suppose you have to forecast for multiple time series. In that case, you can also carry out cross-validation on each time series individually to perform hyperparameter tuning. Refer here for more details:
https://facebook.github.io/prophet/docs/diagnostics.html
Alternatively, you can check time series clustering packages such as this one:
Conclusion
We can use Facebook’s Prophet package to capture sudden trend changes and holiday effects, as you have noticed above. This is especially important in the year 2020, where the effect of COVID is imminent across most business scenarios. To conclude, here are a few points to keep in mind while forecasting with Prophet:
-
Explore the data thoroughly before moving to the modeling phase.
-
Notice any drastic trend changes at any point in time to be considered potential changepoints.
-
Analyze if you need to add any custom seasonalities other than daily, weekly, and yearly seasonalities.
-
Check if the seasonality strength is the same across the time period of your data. If an external event such as COVID influences the seasonality strength, define separate windows to accommodate the respective seasonality strength effects.
-
Understand why there are spikes; is it due to holidays/special events? Notice if there is any other factor(s) influencing those values and see if you can add the features as regressors.
Also, check out our blog, "A Regression Approach To Forecasting Demand During COVID-19", here. To get the best artificial intelligence solutions for your business, reach out to us at Clairvoyant.
References
Documentation of Facebook Prophet. Retrieved from: