Determine if Two Products are the same by their Image and Text Descriptions
Introduction
Shopee is a Singaporean multinational company that focuses mainly on e-commerce platforms. The company was launched in the year 2015 and is dominant in the South Asian market.
This blog talks about a Kaggle competition where the problem is to identify if two products are the same by comparing the image and description.
Problem Description
The main problem is to apply machine learning skills to build a model that predicts which items are the same products and which are not. The product matching should be done automatically as soon as the retailer uploads its product. The need for building the model is to see that there is no duplication of products. Product matching could support more accurate product categorization and uncover marketplace spam. This would benefit the customers from more accurate listings of the same or similar products as they shop.
Data Description
The data for this competition is presented in both text and images and can be downloaded here. The text contains posting ids, image ids, perceptual hashes of the images, product descriptions, and labels, which are the ids for all postings that are the same product.
The images are provided separately with corresponding image ids.
The data is structured in the following way:
-
Test
-
Test_images: The product photos to be predicted.
-
Test.csv : Contains the metadata in comma-separated values.
-
-
Train
-
Train_images: The product photos for training(~32.4K)
-
Train.csv: Contains the metadata; the description of the product and a label_group_id that marks the images with identical products.
-
Exploratory Data Analysis
Exploratory Data Analysis refers to the critical process of performing initial investigations on data so as to discover patterns, spot anomalies, test hypotheses and check assumptions with the help of summary statistics and graphical representations. This helps data scientists understand what the data represents, consider the trends, look at holes in the dataset and formulate their next step which is data preprocessing.
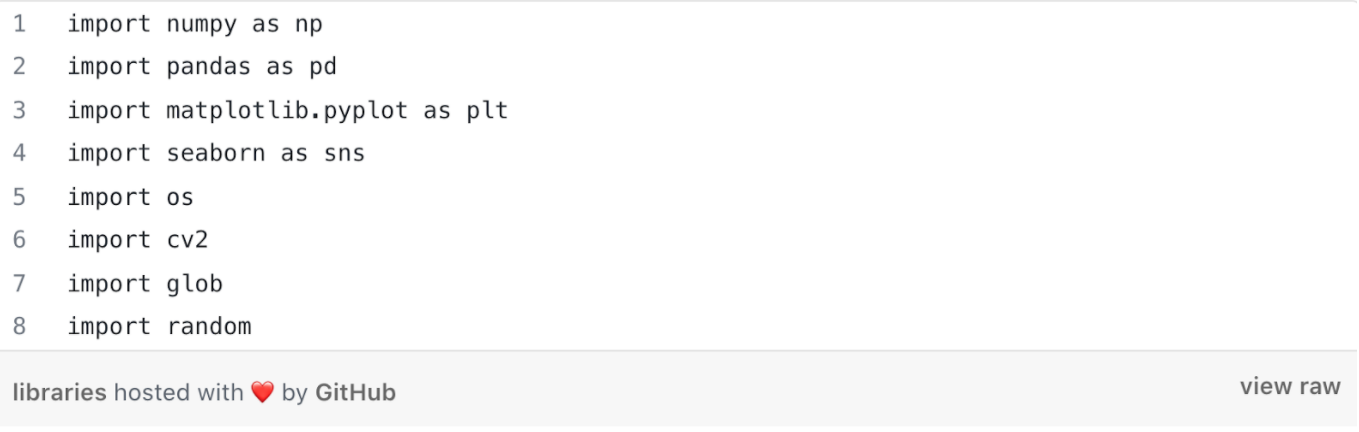
Importing the Libraries
Pandas: It is a software library written for the Python programming language for data manipulation and analysis.
Numpy: It is a library used for working with arrays. It also has functions for working in the domain of linear algebra, fourier transform, and matrices. NumPy stands for Numerical Python.
Seaborn: Seaborn is a data visualization library based on matplotlib.
Matplotlib: Matplotlib is a plotting library for the Python programming language and its numerical mathematics extension NumPy.
Plotly: Plotly allows us to import, copy and paste, or stream data to be analyzed and visualized. For analysis and styling graphs it offers a Python sandbox (NumPy supported), Datagrid, and GUI. It is a scientific graphing library.
Reading the csv files:
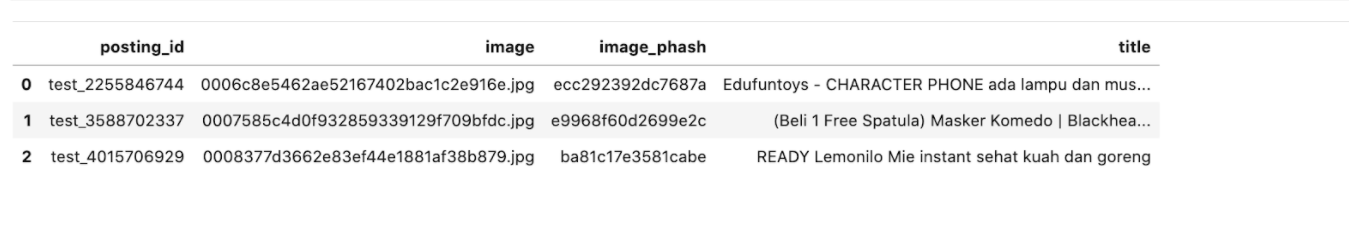
Train:
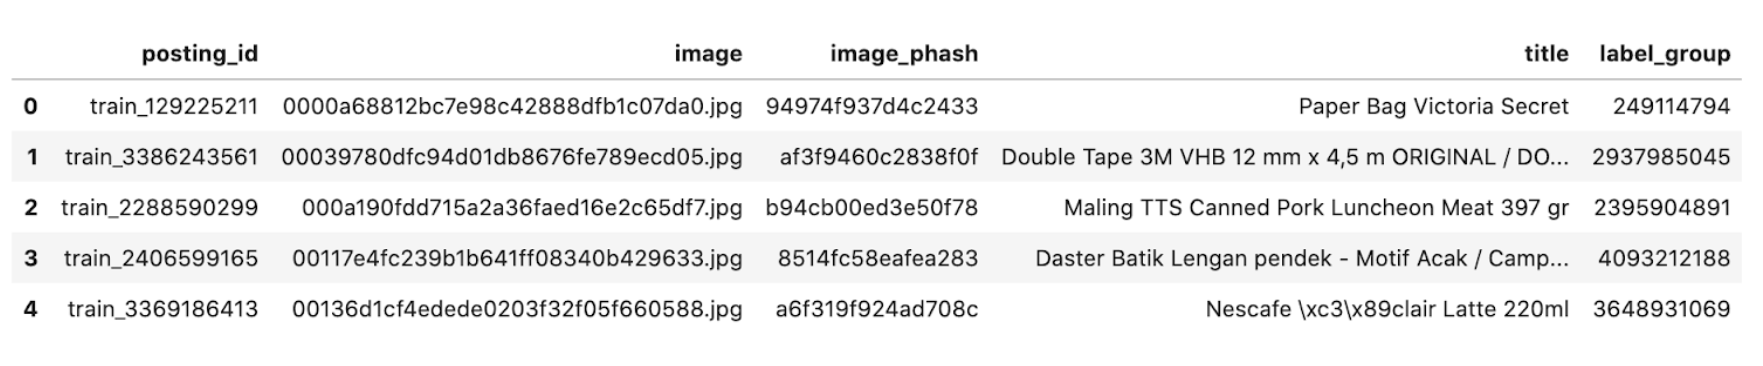
The above code shows the training data. There are 5 columns: posting_id, image, image_phash, title, and label_group.
Test:
The test data has four columns namely, posting_id, image, image_phash, and title.
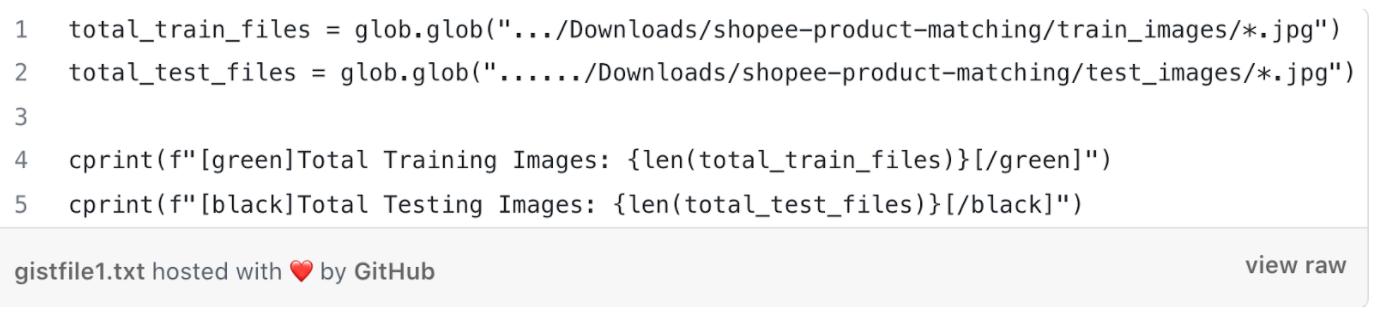
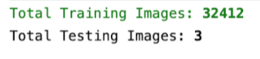
Reading the total number of Training and Test Images:
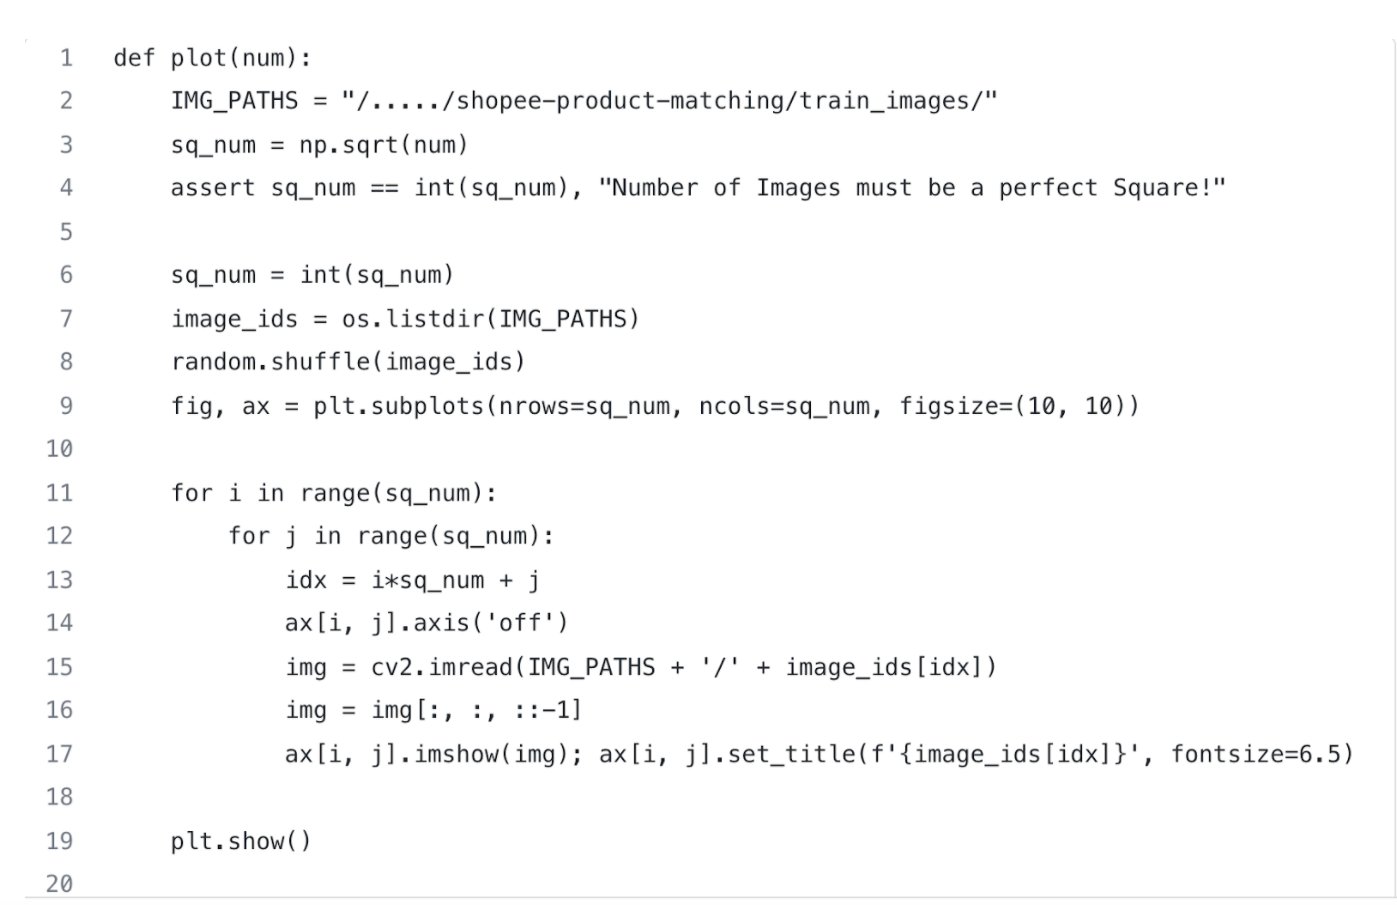
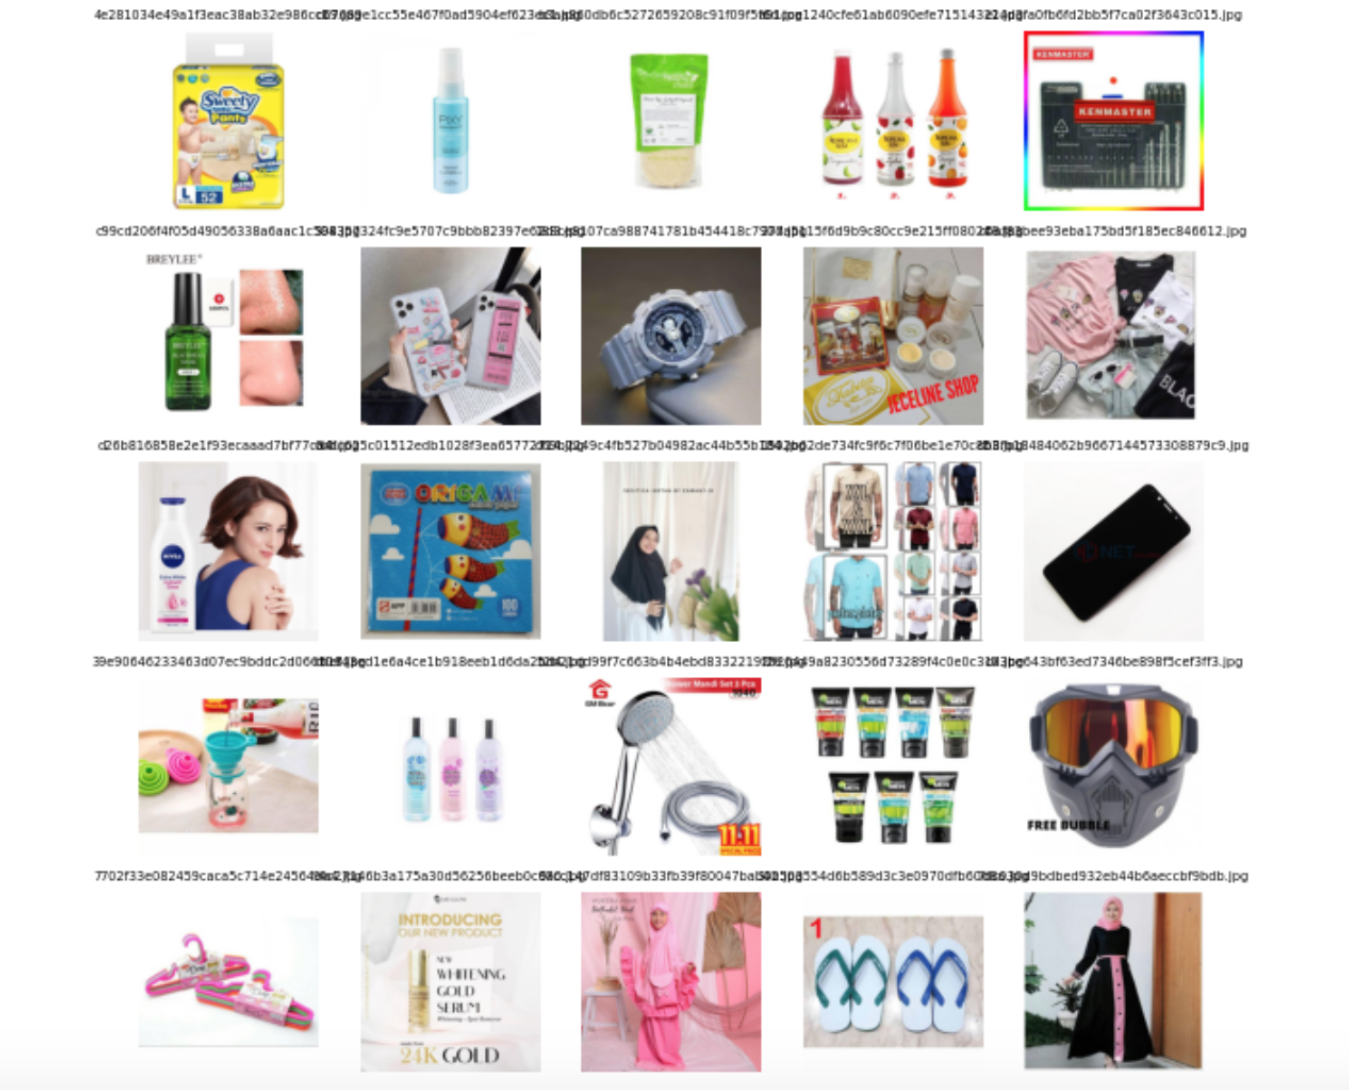
Displaying images randomly:
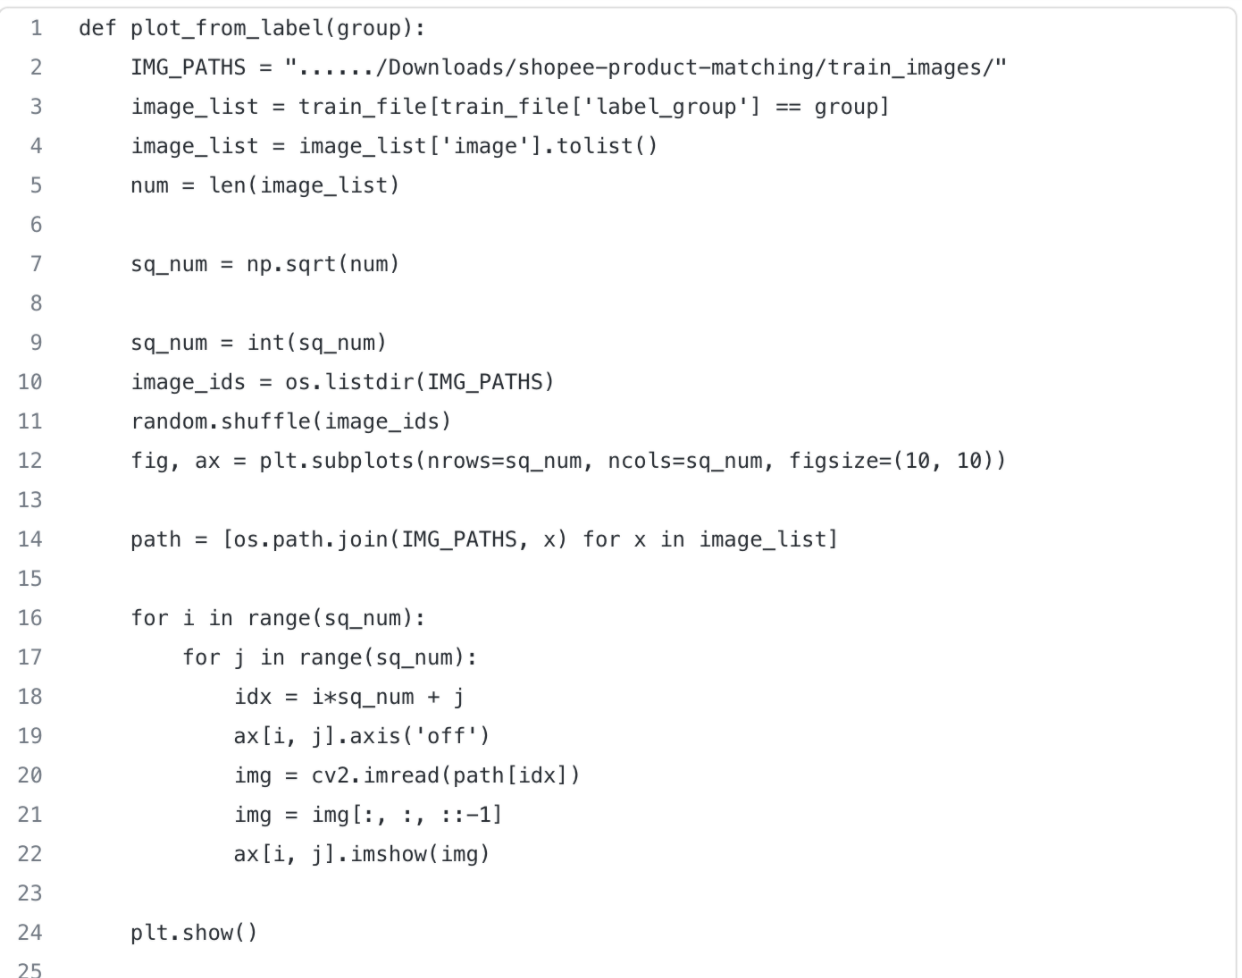
Plotting similar products based on product number:
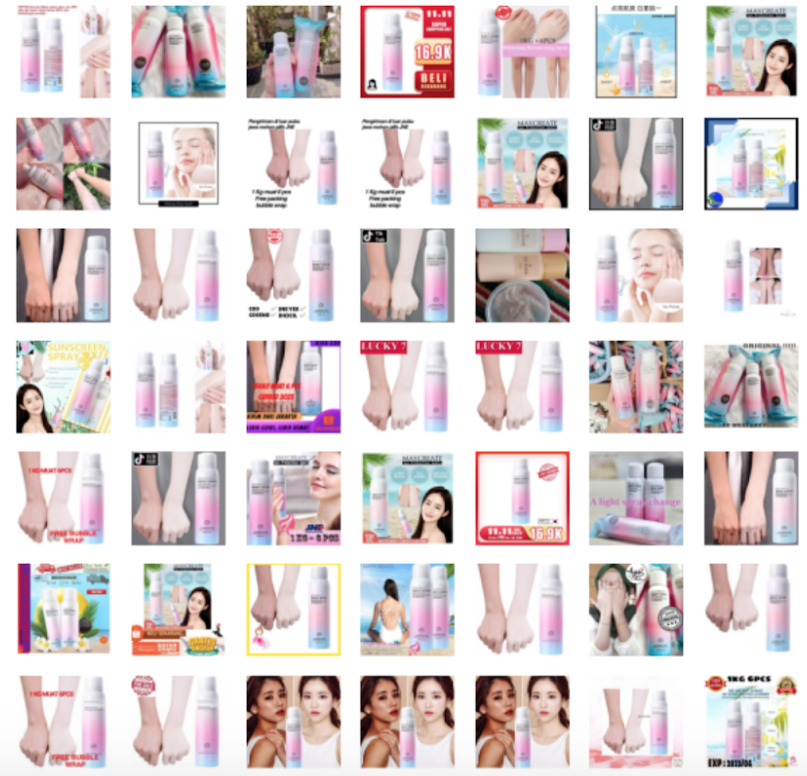
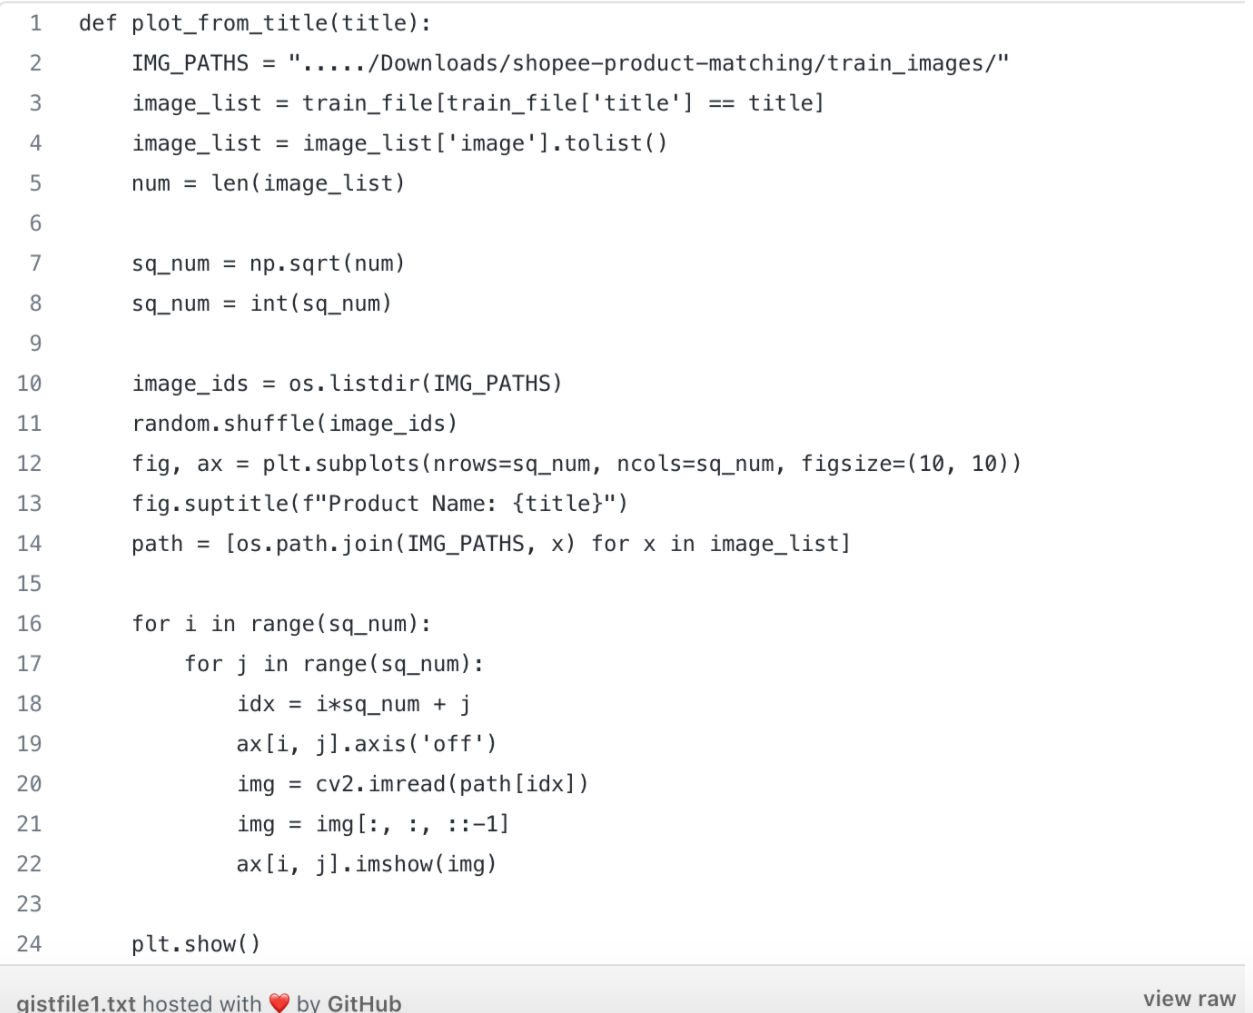
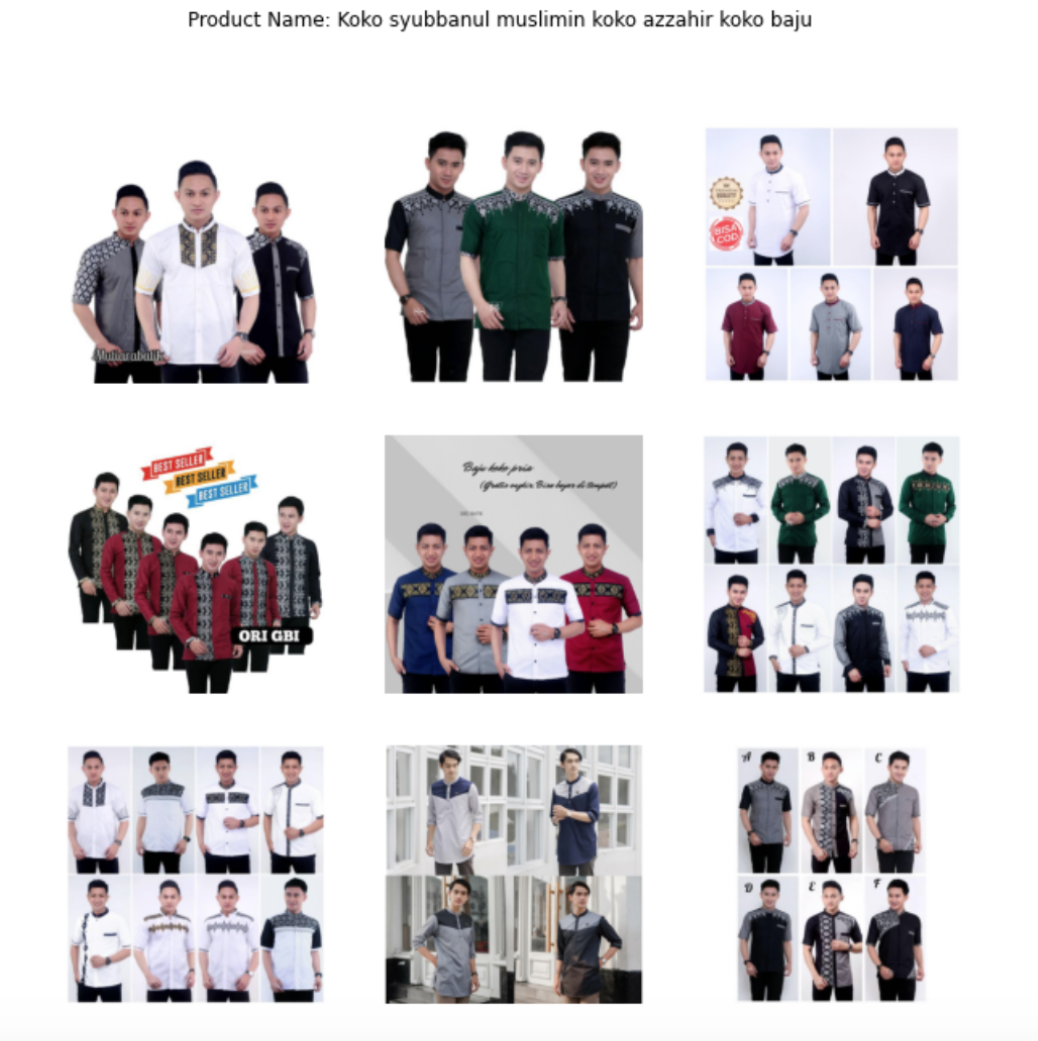
Plotting products based on product name:
Displaying top 15 Image Label Groups:
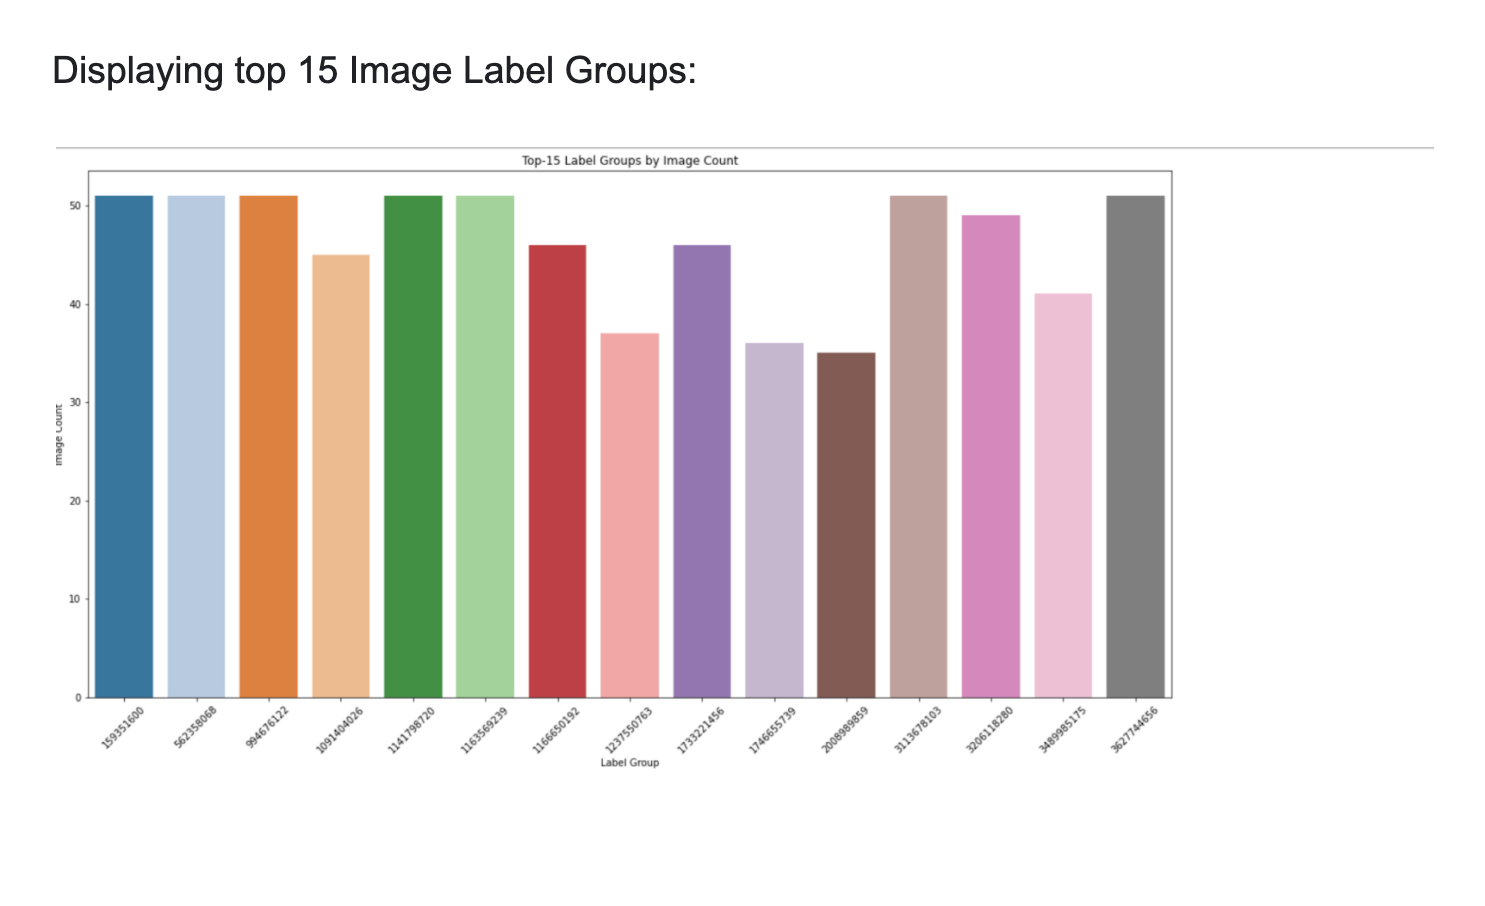
These are the top 15 label groups in the dataset. The y axis shows the image count and the x-axis shows the label group with which the product is tagged.
Plotting between Duplicate Count and Unique Item Count
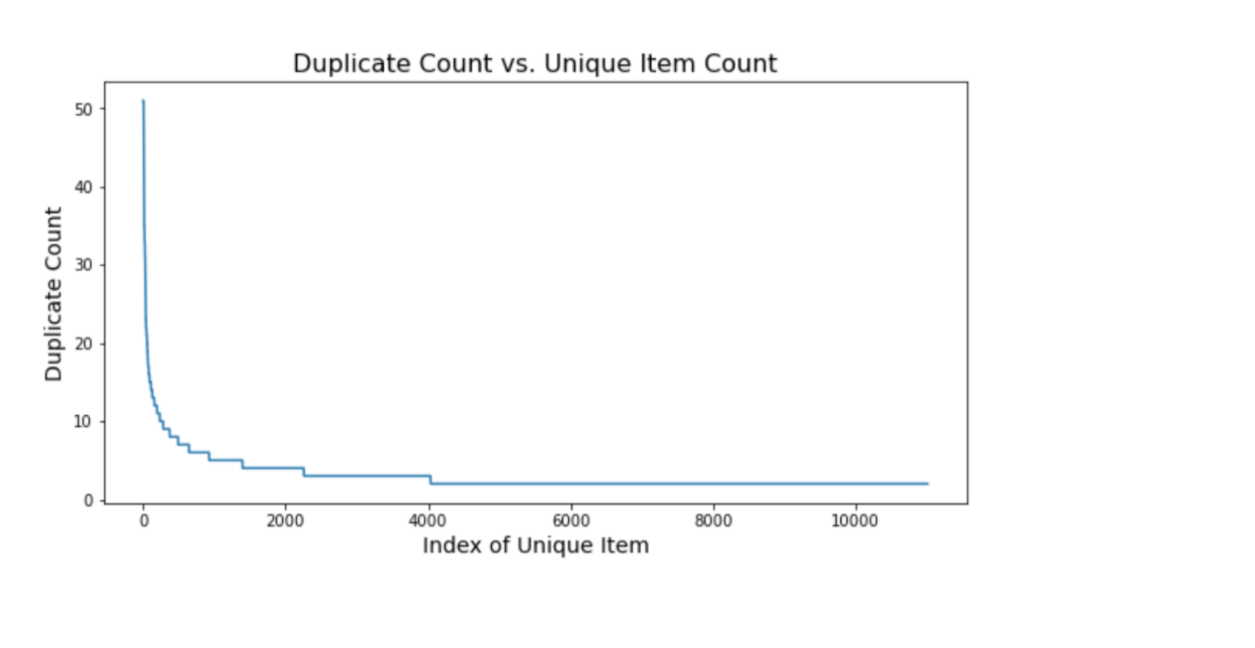
This is a plot between the Duplicate Count and the Index of Unique Item. On the y axis is the duplicate Count while on the x-axis, is the Index of Unique Item. In the starting, the duplicate count is very high but gradually it comes down.
Plotting top 50 duplicate items:
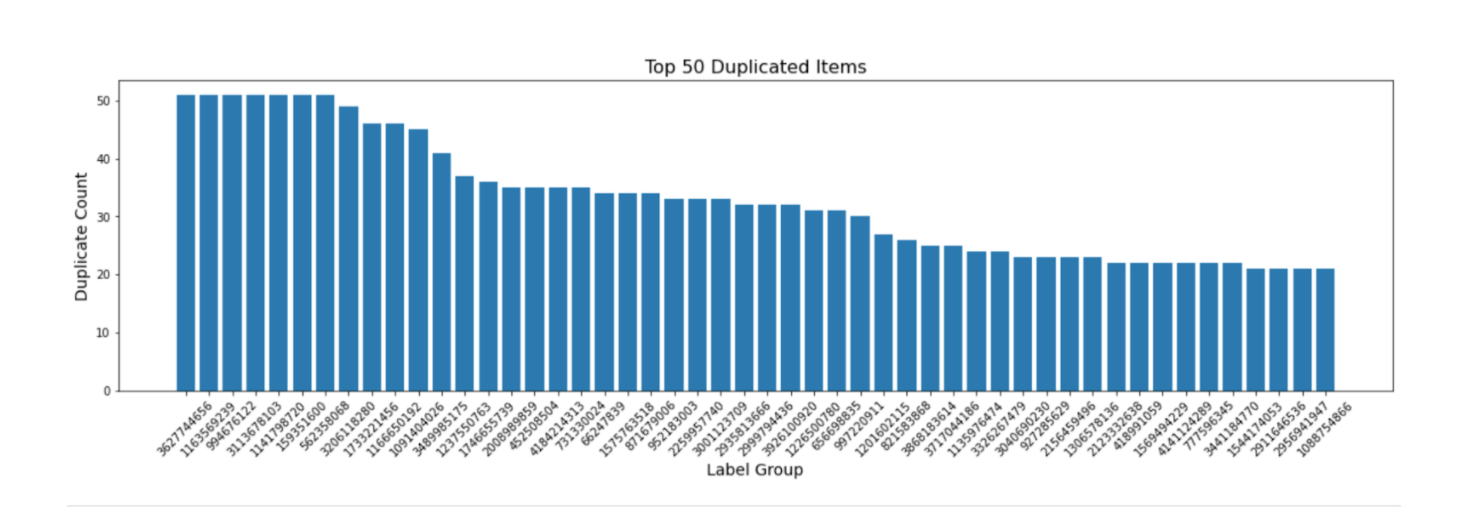
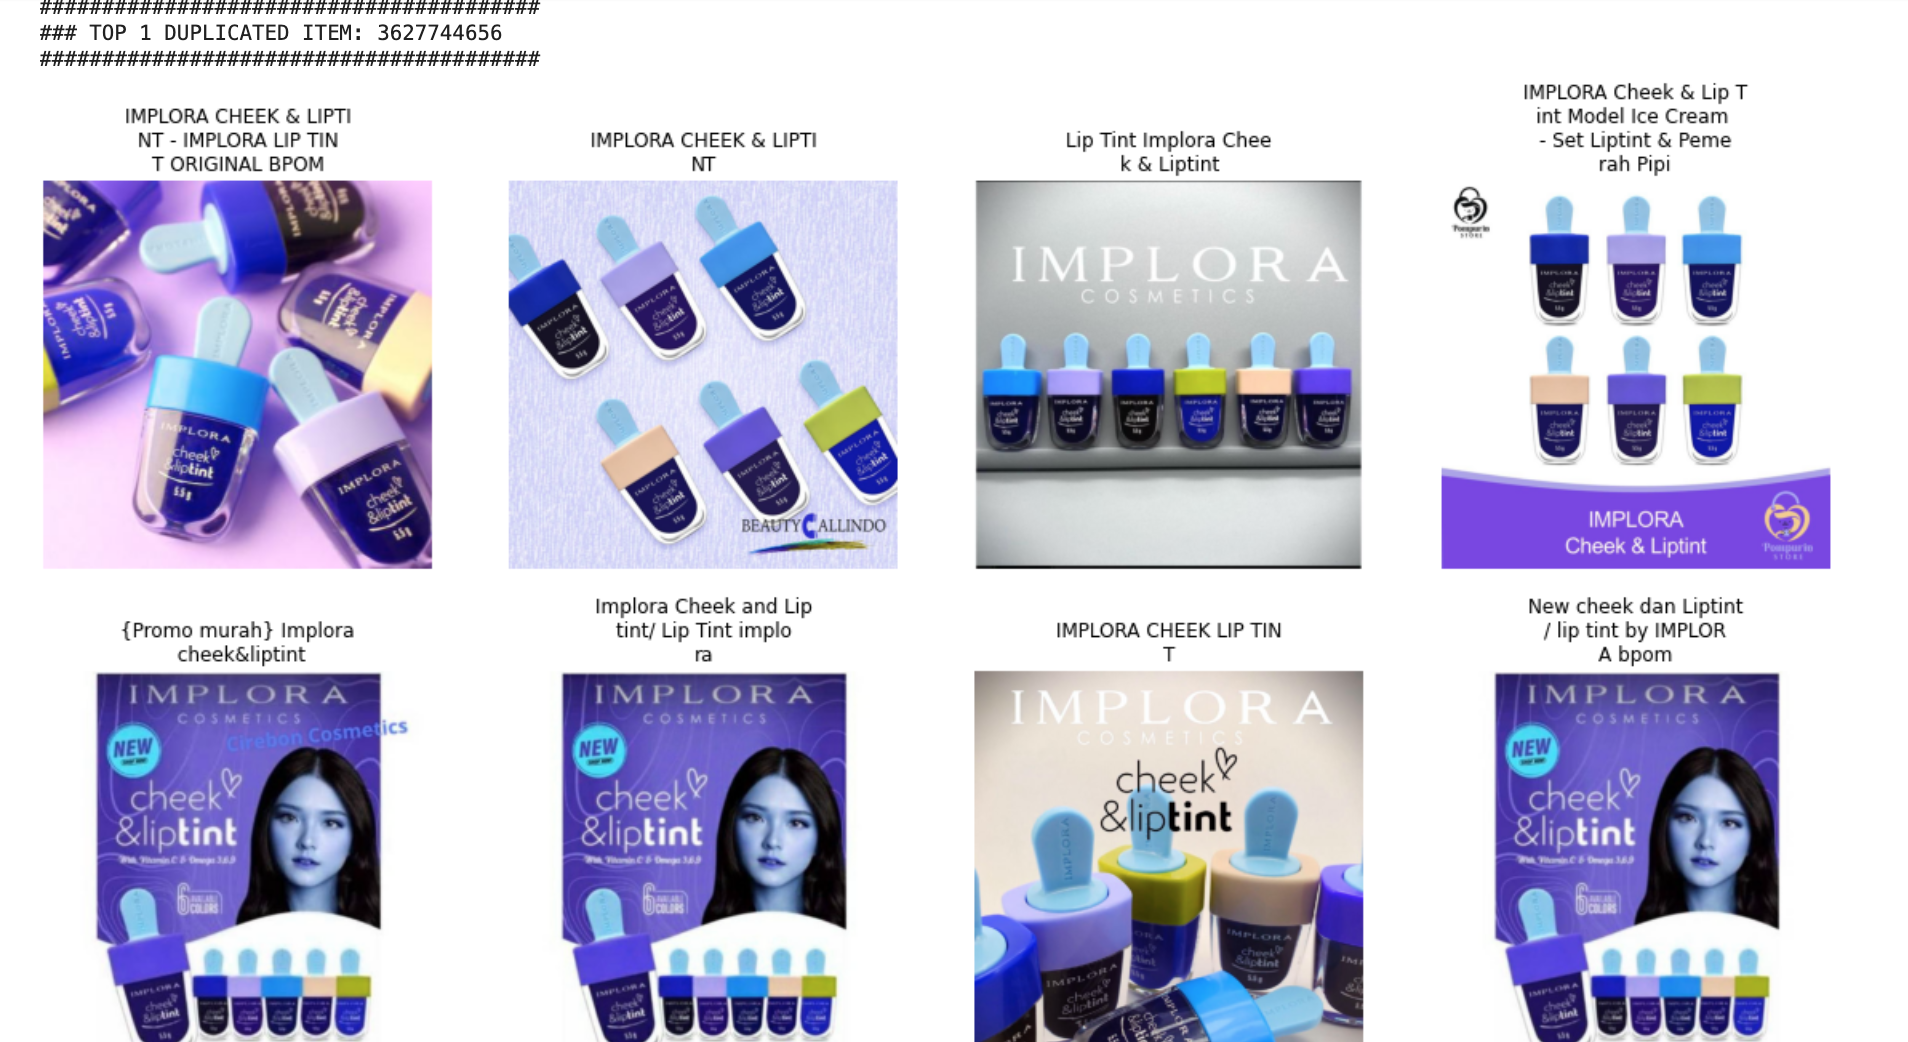
The above plot shows the top 50 label groups which have the most number of duplicate counts. Label 3627744656 has the highest count with 50 duplicates.
Displaying top three duplicate items
Following are the top three duplicate items:
-1.png)
-3.png)
Evaluation Metrics
F1 score is a measure of a model's performance. It is calculated as the harmonic mean of precision and recall on tests. Its best value is 1 and its worst score is 0.
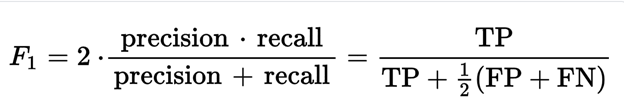
Where:
TP- Number of True positives
FP- Number of false positives
FN- Number of false negatives
For more information on F1 scores, please visit this site.
Models Used
The problem has data in multiple formats i.e. text and images. Hence, it is crucial to utilize and combine these modalities well. To solve this problem, we produced text embedding and image embedding, then normalized them, concatenated them, and used cosine similarity to find the similarity.
-
Text Similarity Estimation:
For estimating similarity between texts, we used TF-IDF embeddings and Sentence BERT scores.
-
TFIDF:
TF-IDF stands for ‘Term Frequency — Inverse Document Frequency’.
It is a way of vectorizing the text data. In TF-IDF, we compute a score for each word in the document to signify its importance in the document and create a vector for each document whose dimensions are the number of unique words in the corpus. This technique is used widely in information retrieval and text mining.
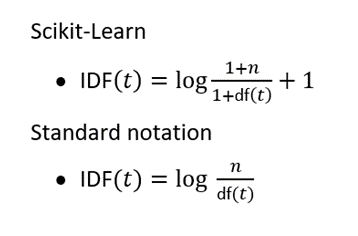
Here,
n= total numbers of documents in the document set and df(t) = document frequency of t.
For further information please visit this site.
-
Sentence BERT:
BERT- ‘Bidirectional Encoder Representations from Transformers’ is a Natural Language Processing Model proposed by researchers at Google Research in 2018. It is designed to learn deep bidirectional representations from the text by jointly conditioning on both left and right contexts.
Sentence-BERT (SBERT) is a modification of the pre-trained BERT network that uses siamese and triplet network structures to derive semantically meaningful sentence embeddings that can be compared using cosine-similarity.
The bidirectionality of a model is important for truly understanding the meaning of a language. For understanding let us take an example.
There are two sentences in this example and both of them involve the word “bank”:
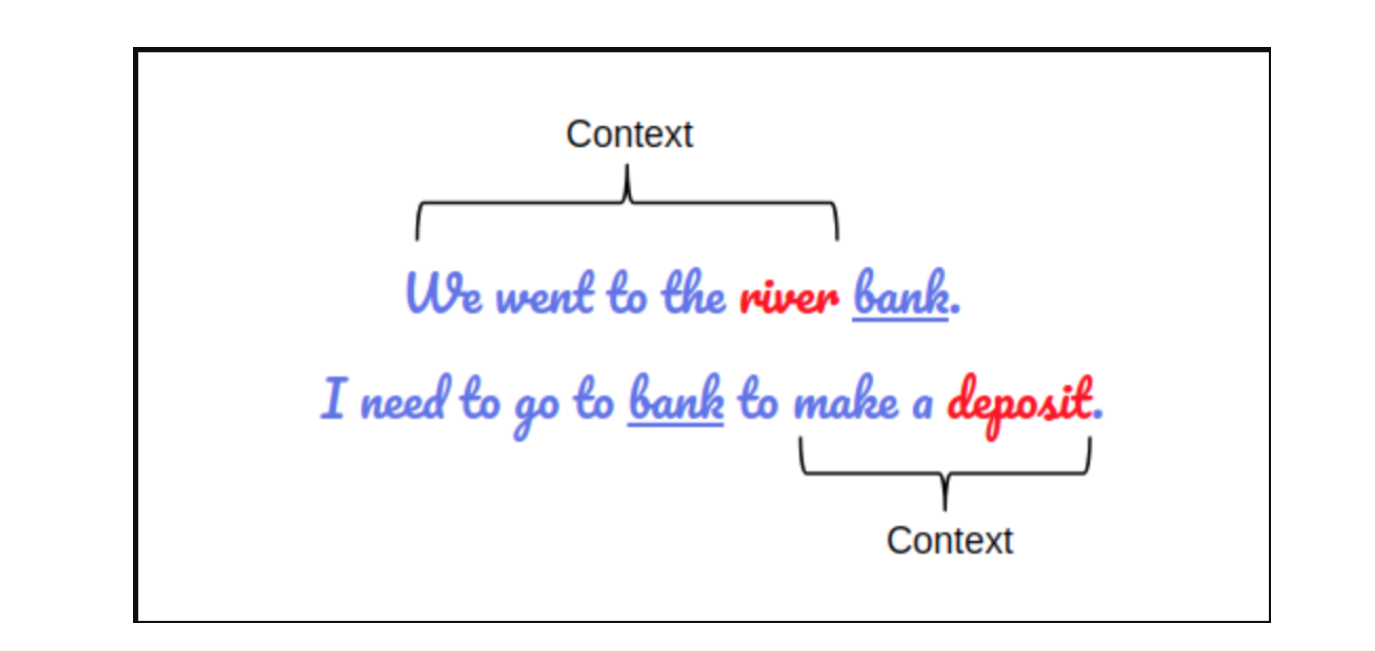
If we try to predict the nature of the word “bank” by only taking either the left or the right context, then we will be making an error in at least one of the two given examples.
One way to deal with this is to consider both the left and the right context before making a prediction. That’s exactly what BERT does. Apart from this, we can fine-tune it by adding just a couple of additional output layers to create state-of-the-art models for a variety of NLP tasks.
For further information please visit this site.
-
-
Extracting Features From Image Data
-
Efficient Net
Efficient Net is a convolution neural network, ways to scaling are as follows:
-
Increasing width of the model
-
Increasing depth of the model
-
Increasing resolution of the model
In order to overcome this problem a parameter called compound scaling is used which gives a rough estimate on how much depth, height, and resolution should be changed in order to achieve maximum performance. For more information please visit this link.
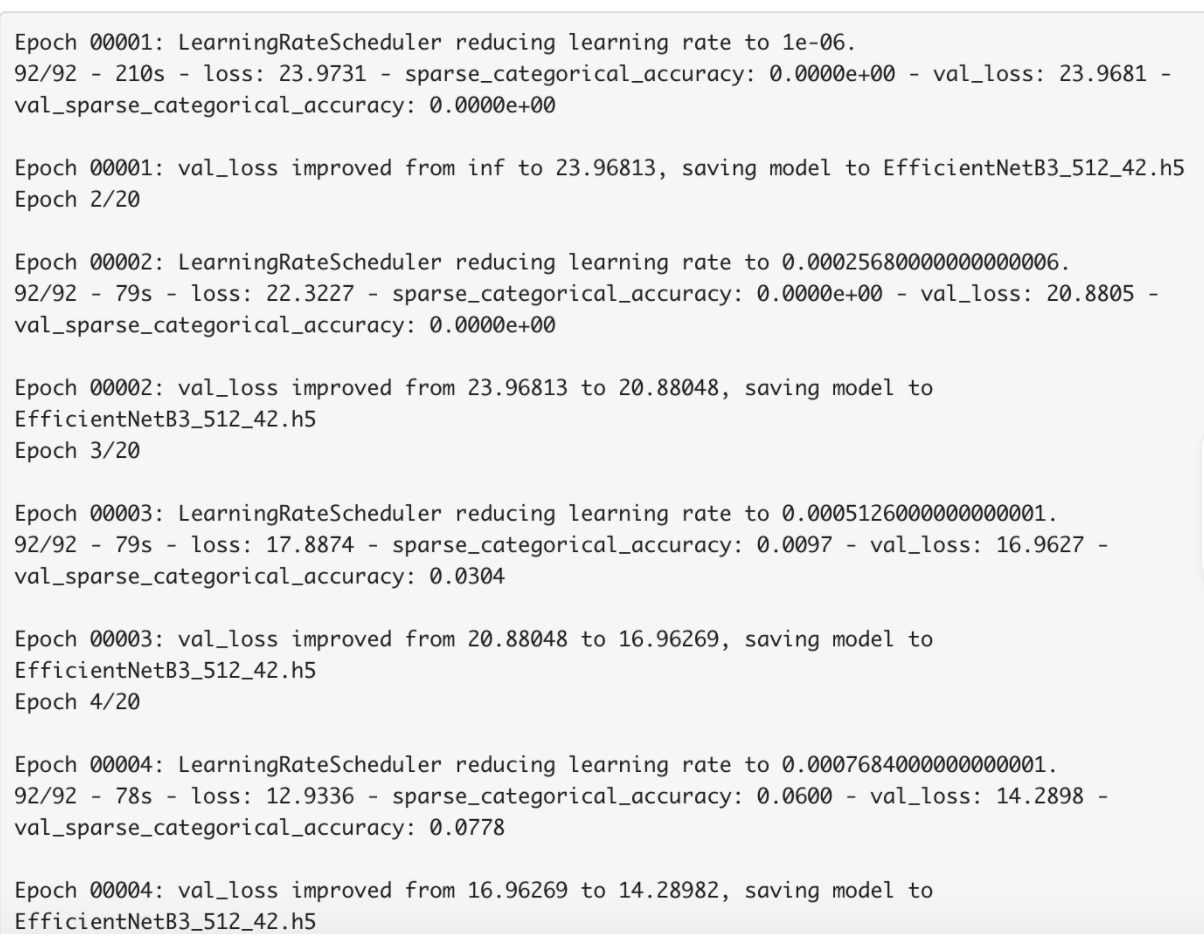
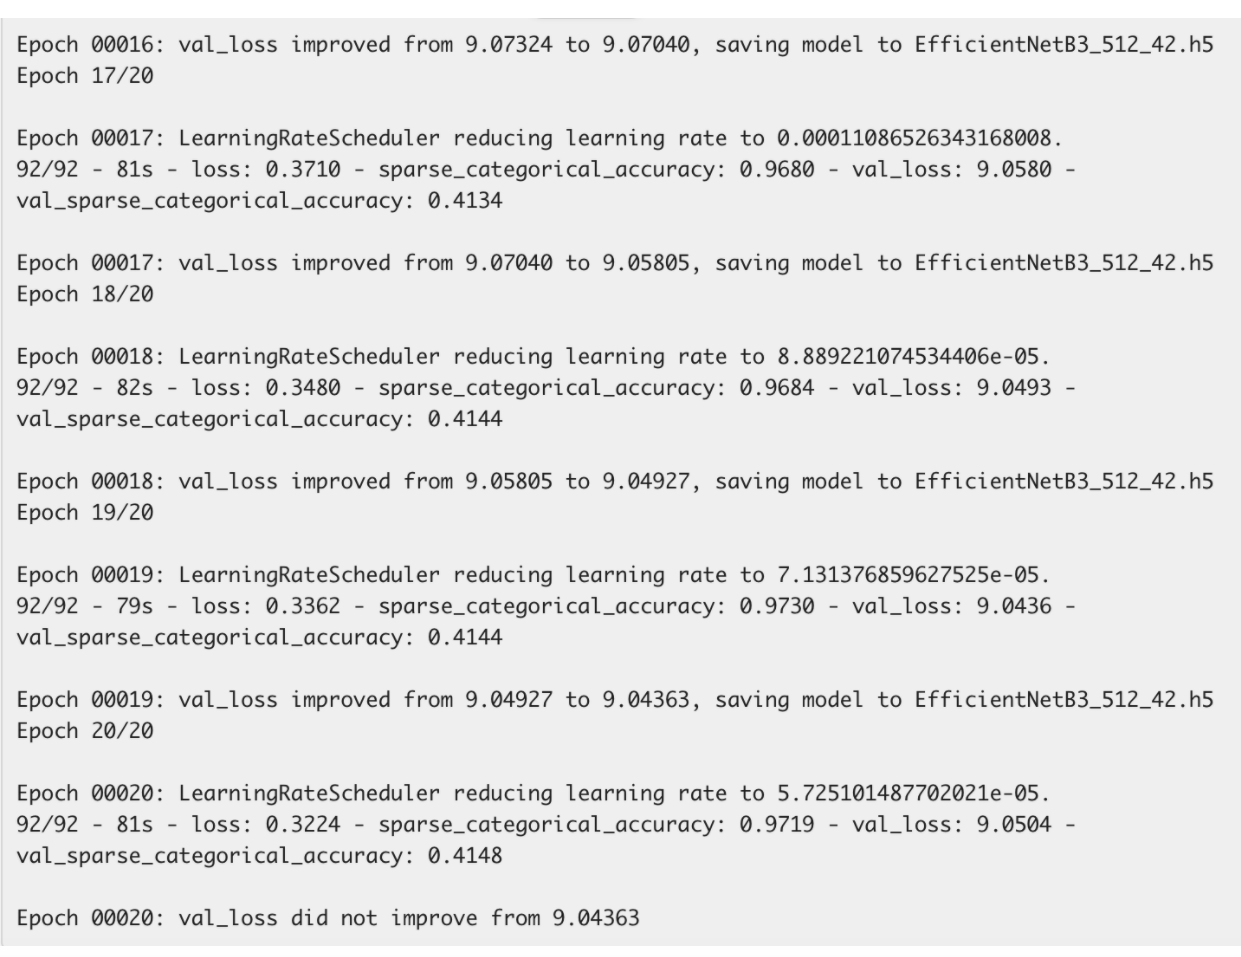
Summary of the model:
-
-
Arcface loss
Using softmax loss for image similarity has some drawbacks, one of them is that it does not explicitly optimize the feature embedding to enforce higher similarity for intra-class samples and diversity for inter-class samples, which results in a performance gap. Siamese loss can do that but increasing data leads to combinatorial explosion. Also, semi-hard sample mining is a quite difficult problem for effective model training with siamese loss. Arcface solves both computational as well as performance issues.
Arcface loss adds an angular margin term to the loss and minimizes the geodesic distance between the pair of images belonging to the same class. Similar to text, on top of obtaining the feature vectors, we also added more features by calculating the “distance measure” for each feature vector pair.
-
Post-processing
-
Neighborhood Blending
The purpose of neighborhood embedding blending is to use the neighboring items' information to refine the query item's embedding and make the cluster clearer. For that, we simply weighted-sum the embeddings of neighbors with a similarity more than the threshold and using similarity as weights, added it to the query embedding.
-
Concatenating Text and Image Embeddings
We have text and image inputs, and we need to combine them and utilize them effectively. We concatenate image and text embeddings to produce a combined match. We normalize image embedding and text embedding then CONCAT them to calculate comb-similarities. Actually, it is the same as calculating similarity from image embedding and another similarity from text embedding, then averaging them.
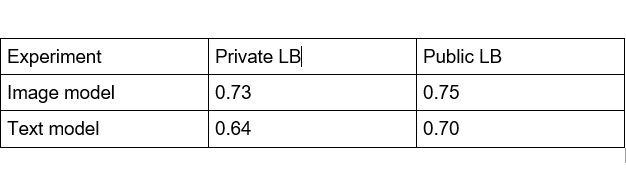
Result
For predicting how well our model has performed in matching the different products. To check the model’s performance we will find the F1-score of the predictions. The F1 score for our model is:

The max F1 score we achieved is 0.754 which is pretty good.
Conclusion
The models that we have used are quite decent. But still, a lot more can be done for improvement. For extracting text from text data we used two models: TFIDF and BERT model, there are other models like FastText, etc which can be used, and for extracting images from the data some models that can be used are eca_nfnet_l1, etc. In the future, we can incorporate these techniques to improve our final scores.
You can access the code from this link.
Hope you enjoyed it.