Overview
The Internet of Things, also referred to as the next industrial revolution, is the current hype, but what kinds of challenges do we face with the consumption of big amounts of data? One variant is to collect all the data and do post-processing in batches. However, the preferred way is to do real or near real-time analytics of the latest data.
Continuous streams of data are generated by a single IoT device. Scale it up, and companies can then analyze high volumes of data and perform actions on the same. These actions can include event correlation, statistics preparation, metric calculation, and analytics.
A good analytics platform should be tailored according to three different parameters: right-size infrastructure, performance, and future growth. To maximize performance, a single-tenant physical server dedicated to a single customer is the best fit. To ensure future growth with the right size of infrastructure, a hybrid approach is the best way to go.
To cope with the sheer amount of data, you’ll need a platform which can scale with the amount of data. The platform and the software components need to be able to adjust to the changing requirements depending on the changing influx of data.
The Internet of Things is a broad technology field. There are lots of interesting use cases and upcoming technologies to dive into. This blog focuses on the data digestion part of the lambda architecture. The audience will learn theoretical concepts and see how to apply them in the real world.
Use case
We created an IoT device using a Raspberry Pi with different sensors like an accelerometer, IMU, temperature humidity meter, and GPS tracker. This is a multipurpose IoT device and can be used to address various use cases.
Let’s consider the use case for the trucking industry where truckers are expected to maintain speed, ensure the temperature of the containers are stable, and travel only on the specific route. But in some cases, truckers can travel faster than the posted speed limit and change the route to save time. They may also turn off the container cooling sometimes to save fuel. This may be harmful to the material they carry.
Sensors like accelerometers, IMU provide readings at 10 to 30 readings per second. These sensors can be very useful in the trucking industry, where we can monitor the trucks in real-time to see how the trucker is making progress. We can also analyze this data to figure out road conditions and driving patterns. Apart from this, we can also send alerts to the truckers based on different categories like temperature and speed. Lambda Architecture can play a big role here. We can use real-time data to send alerts, notifications and utilize daily history data for billing, fines, awards, etc.
We focused on temperature and humidity meter for our use case to analyze room temperature and humidity. Our IoT devices send temperature and humidity data every 30 secs. We used these readings to analyze the temperature and humidity of a room that did not have an air conditioning system inside it. With the help of Lambda Architecture, we showed the real-time temperature and humidity on a screen. We sent real-time alerts for different scenarios like the rising and falling temperature and humidity beyond the threshold. We used historical data to find out daily/hourly averages and min, max to conclude the best time to utilize the room.
Architecture
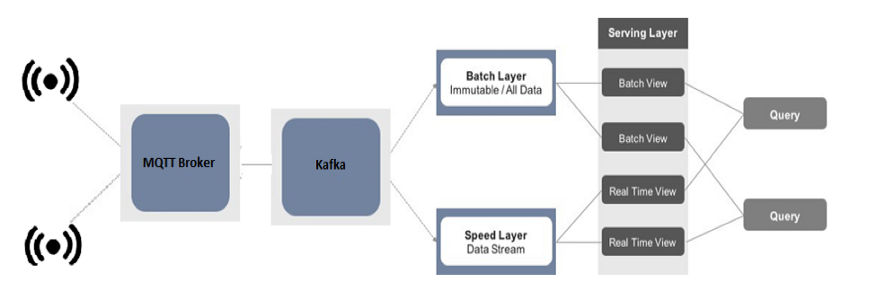
Overview of an analytics application according to the lambda architecture, streaming data from IoT sources (sensors) will be pulled into an analytics engine and combined with historical data.
— Data Ingestion

Sensors -> Kapua (MQTT Broker) -> Kafka

— Data Digestion

Speed Layer — Kafka -> Flink Stream -> HBase

Batch Layer — Kafka -> Kafka Connect / Flink Batch -> Kudu

— UI

Superset, Tableau
Data Ingestion
The data ingest service is an example of how to read data into the IoT Analytics Platform. IoT devices use MQTT protocol to transfer data to the cloud, where a Kapua (MQTT broker) collects the data and passes it to Kafka. A simple bridge application is written in Java which uses Apache Camel for routing the data from Kapua to Kafka.
Data Digestion
The data digestion service delivers the actual business value of an IoT analytics platform. In this part of the application, information can be gathered, transformed, and optimized. In our example, we are putting raw sensor data into HBase to demonstrate the real-time/live data from the sensor. Our streaming layer does this. On the other hand, the batch layer is responsible for maintaining the raw data and performing some aggregation in Per-entry update and using Periodic calculation jobs.
Let’s deep dive through some sample programs.
Speed Layer — Kafka -> Flink Stream -> HBase
-
Read data from Kafka topic temp_humidity
-
Parse the text in the stream to create a DataStream of String objects
-
Write stream to HBase table temp_humidity using HBaseOutputFormat
-
Finally, start streaming
Flink Stream to read data from Kafka topic and write it to HBase table
Sample HBaseOutputFormat
Batch Layer — Kafka -> Kafka Connect / Flink Batch -> Kudu
1. Read data from Kafka topic temp_humidity
2. Parse the text in the stream to create a DataStream of String objects
3. Covert DataStream of String objects to RowSerializable
4. Write stream to Kudu table temp_humidity using HBaseOutputFormat
5. Finally, start a micro-batch
Flink Stream / micro-batch to read data from Kafka topic and write it to Kudu table
UI
Superset allows data exploration through rich visualizations while performing fast and intuitive “slicing and dicing” against just about any dataset. Tableau has a thin semantic layer that defines how datasets should be exposed and enriches the content by adding SQL expressions and metrics.
Both the tools have some unique features that can be used to visualize data better. We are showing live data using Superset, which includes live feed and aggregation of streaming data. Tableau shows the aggregation reports of all the data combing latest and historic.
Considerations
One of the potentially large downsides of the Lambda Architecture is developing and maintaining two different sets of code for your batch and speed/streaming layers.
If we were to implement logic in Hive for batch processing and Flink for real-time stream processing, we would not be able to reuse aggregation logic.
Testing the architecture end to end evolves a lot of components. It’s time consuming and tedious task.
Challenges
1. Need to write custom OutputFormat/Sink Functions for different types of databases.
2. Data persisted in HBase/Kudu is not directly visible, need to create external tables using Impala.
3. Since we are dealing with the time series data, timestamp becomes an important aspect of data modeling. But, if we want to join tables from different data sources handling timestamp related queries becomes difficult. The best approach is to store timestamps as UNIX time.
Learn how to implement an enterprise IoT solution for manufacturing in our blog here. To get the best data engineering solutions for your business, reach out to us at Clairvoyant.