In our earlier article on survival analysis, we saw the importance and application of survival analysis where we analyzed the survival probabilities using Kaplan Meier curves. But KM curves work with only one categorical predictor ignoring the effects of all other predictors. Hence arises a need for a better model that can simultaneously assess the impact of all the numeric and multiple predictors on survival times. In survival analysis, predictors are often referred to as covariates.
Cox Proportional Hazards (CPH) model is a commonly used semi-parametric model used for investigating the relationship between the survival time and one or more variables (includes categorical and quantitative predictors).
Before getting there, let’s define a few keywords that we shall be using-
-
‘Hazard rate’ is the rate at which an event (like death, failure, etc.) happens at a time t
-
A ‘hazard function’ (denoted by h(t)) represents the risk of occurrence of an event at time t, given a set of predictors xi.
CPH model is expressed by the hazard function, h(t) and an estimate for h(t) is given as:

Where,
-
xs are the predictors
-
bs are the coefficients of the predictors which indicate the measure of the impact of their respective predictors
-
h0 is the baseline hazard. It is the value of the hazard if all xs are zero
-
the quantities exp(bi xi)are called ‘hazard ratios’ (HR)
Things to note here:
-
t in the hazard function indicates that the hazard changes with time
-
A value of bi > 0 (implies a hazard ratio greater than one) indicates that as the value of the i-th covariate/ predictor increases, the hazard of the event increases and hence the length of survival declines
-
If Hazard ratio (HR) given by exp(bixi)is:

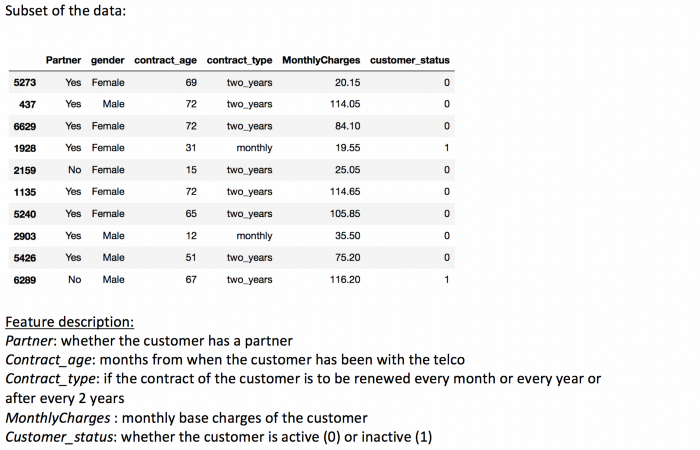
A use case on customer churn data (as in the earlier article):
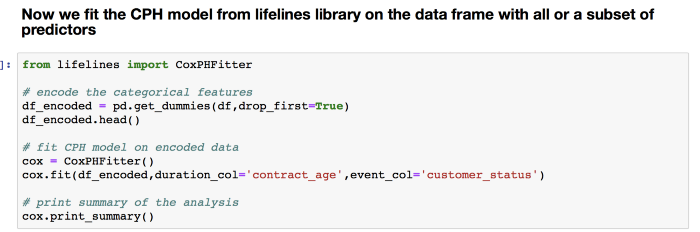
CPH model throws an error when multi collinear predictors are present in the data set. So, the categorical features should be encoded, and multi-collinearity needs to be fixed before fitting the Cox model on any dataset.
Let’s look at the summary of the CPH model:
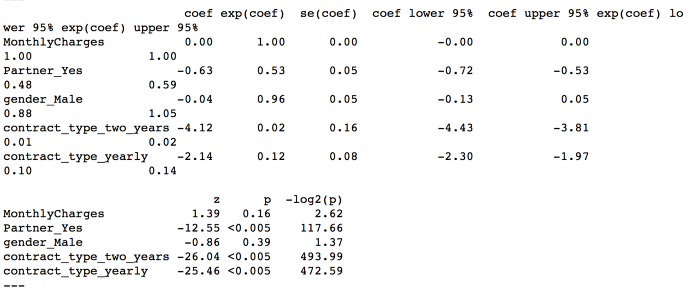
Interpreting the summary
-
The hazard ratio (HR) given under exp(coef) against each predictor shows that MonthlyCharges feature with exp(coef) = 1.0 has no effect on the hazard
-
Partner_Yes feature with exp(coef) = 0.53 (i.e., less than 1) which means a decrease in hazard and hence better survival. So, having a partner reduces the hazard by a factor of 0.53 and hence if a customer has a partner, it’s a good prognostic for better survival
-
Looking at the p-values of the predictors make it clear that the predictors Partner_Yes, contract_type_two_years and contract_type_yearly are significant (as p-values are < 0.05 at 5% Level of significance thereby not accepting the null hypothesis of the CPH model that all the predictors have zero significance) and MonthlyCharges, gender_Male are insignificant (as their p-values are >0.05)
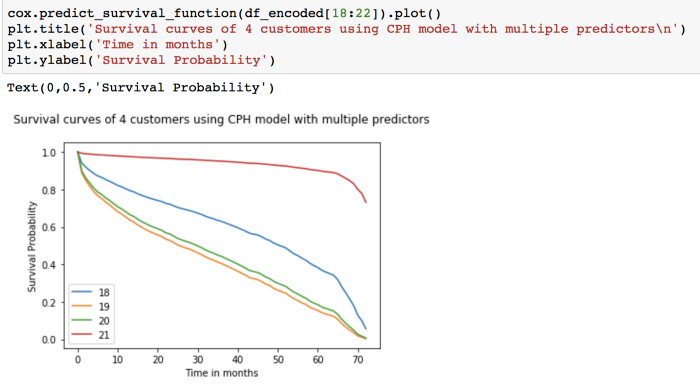
Predicting survival function for individual customers:
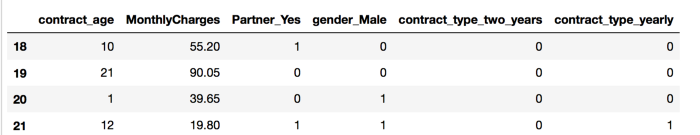
Let’s look at these customers’ details:
From the plot of the survival curves and based on our earlier summary analysis, Customer- 21 is predicted to have a higher and longer survival probability than the other 3 customers as Partner_Yesand contract_type_yearly is true.
Conclusion
Though there are many more key statistical concepts that go into survival analysis, these blogs on survival analysis were mainly intended to highlight the importance and intuition behind survival analysis during the process of data exploration. To get the best artificial intelligence solutions for your business, reach out to us at Clairvoyant.