Purpose
The purpose of building this open-source plugin is to monitor Spark Streaming Applications through Nagios, an Open Source Monitoring tool that we’ve used extensively for Machines, Networks, and Services.
The plugin displays a CRITICAL Alert state when the application is not running and an OK state when it is running properly.
GitHub URL: link
Deployment & Configuration
Prerequisite
-
The Nagios Agent should be running on a machine with the `yarn` command available and necessary configurations running on it.
-
If you’re utilizing Kerberos, ensure that the Nagios Agent user has the privileges necessary to obtain an authentication token.
Installation Steps on the Nagios WebServer
-
Download and save the script responsible for monitoring the spark streaming applications (spark_streaming_monitor.sh) under /usr/local/nagios/etc/libexec/.
-
Make the script executable:
chmod +x /usr/local/nagios/etc/libexec/spark_streaming_monitor.sh
-
Create a service definition for the monitoring service:
Service Definition
# Path: /usr/local/nagios/etc/objects/localhost.cfg

define service{

   use local-service

   host_name localhost

   service_description Spark Monitor <sparkAppName>
   # service_description Spark Monitor TestSpark

   check_command spark_monitor!<sparkAppName>
   # check_command spark_monitor!TestSpark

}
# <sparkAppName>: the name of the Spark Streaming Application
set through the --name flag when submitting the application to spark-
submit
Installation Steps on the Nagios Agent
-
Create a command definition for the monitoring service:
Command Definition
# Path: /usr/local/nagios/etc/objects/commands.cfg

define command{

   command_name spark_monitor

   command_line $USER1$/spark_streaming_monitor.sh $ARG1$
}

# $ARG1$ contains the sparkAppName passed through the service
definition.
Configuration Check
-
Ensure the service is visible on the monitoring dashboard accessible at http://<nagios-hostname>/nagios/.
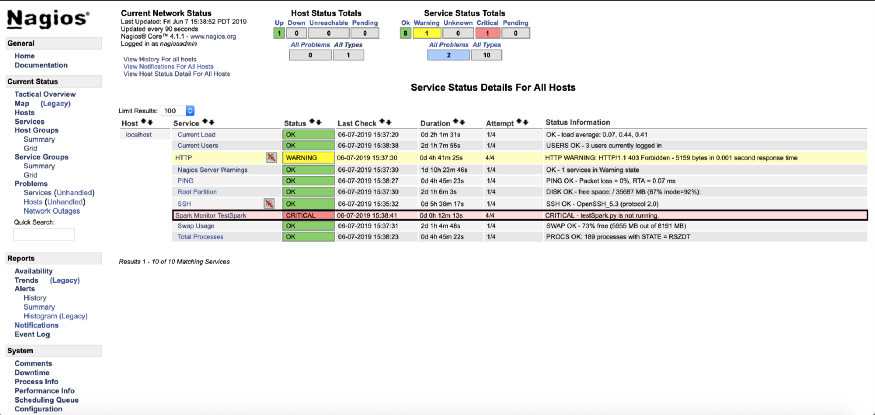 Spark Monitor Plugin
Conclusion
All done! Now, you should be able to monitor any and all of your spark streaming applications at a glance from the Nagios dashboard.
To get the best data engineering solutions for your business, reach out to us at Clairvoyant.