A guide to application monitoring in AWS
A significant number of applications are on the cloud these days. The on-premise applications are in the minority now and have their own reasons to be there, which is a topic for another day.
Today as more and more applications are going up on the cloud, there is an increased responsibility to have them available at all times, making them resilient, scale in and out as needed, and most importantly, monitor them closely.
We are going to discuss how to do application monitoring in AWS.
CloudWatch is a service provided by AWS for —
-
Monitoring applications — Dashboards
-
Creating metrics
-
Writing and viewing application logs
-
Creating alarms
-
Log insights — querying over the application logs
-
Events and Rules
-
Container Insights
-
Lambda Insights
… and a few more, but the ones above are prominent.
In this article, we are going to cover —
What are CloudWatch Metrics and how to create them?
What is a Metric?
Metric is a measure of quantitative assessment commonly used for comparing, and tracking performance.
In application terms, it translates to the data that allows us to assess and understand how the application performs under various circumstances. Situations like heavy traffic, heavy computation, intense processing, etc., test our application and its limits.
It becomes important to assess how our application behaves in such scenarios and identify the bottlenecks to make the application stay true to the principles of high availability, resilience and scalability.
How is a metric created?
There are 2 kinds of metrics.
-
Provided by AWS (AWS Namespaces — see below picture)
-
Custom created (Custom Namespaces — see below picture)
Provided by AWS
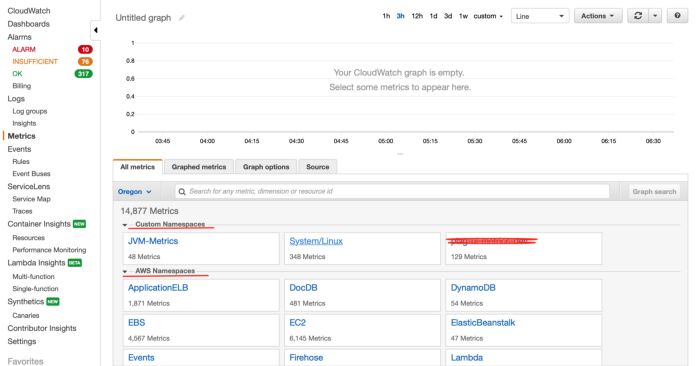 The CloudWatch Landing Page
CloudWatch, as a service, is not enabled by default for all the applications as it incurs cost. If we choose our application to be monitored by CloudWatch, then the data related to certain aspects of the application is sent to CloudWatch as a data point for a metric.
This is a continuous process and the application keeps sending data points to CloudWatch to be shown in the appropriate metric in relative terms.
A CloudWatch metric is a namespace at which all the relevant data points from the application aggregate and are shown as a graph in a relative manner to better assess the condition.
In the above picture we can see the AWS Namespaces created by AWS for the applications that subscribe to CloudWatch service. There are many metrics created and made available to us like —
-
Application ELB (Elastic load balance)
-
ElasticBeanstalk (Metric for Beanstalk applications)
-
Lambda (Metric for Lambda applications)
Let’s take a sneak peek into one of those —
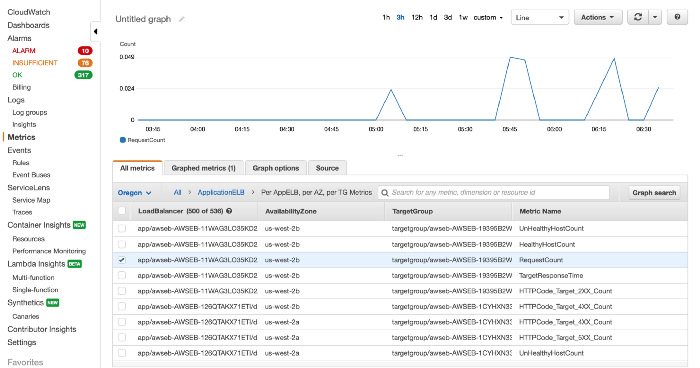 Application ELB metric for Request Count
This is the metric created by AWS for ApplicationELB and the one shown here is the graph for request count metric. Similarly, we can see other metrics there, such as TargetResponseTime, UnHealthyHostCount, etc.
A Custom Created Metric
Let’s talk about custom-created metrics.
In some cases, we need to create our own metric and push it to CloudWatch to address our problems better. As the default metrics don’t cover all the aspects, we need to have some specific implementations for them.
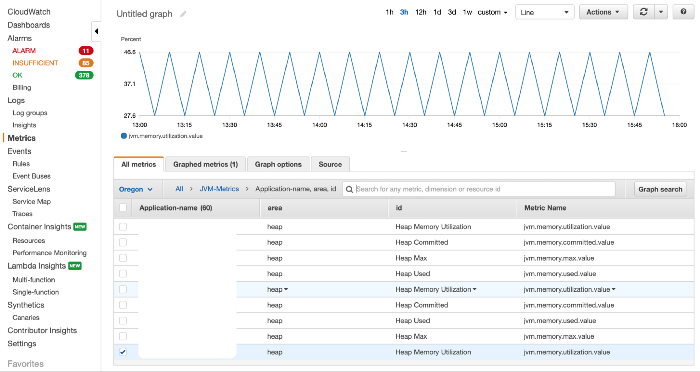 Custom created Jvm metrics
In the above picture, the metrics talk about JVM-Memory utilization. Default metrics don’t provide us with detailed information about JVM memory usage and utilization pattern. So, we created a custom metric called ‘JVM-Metrics’ and pushed the relevant data to this namespace to be converted as a graph. This gives us an understanding of where and when the utilization is going high.
How to create these metrics?
We have used micrometer cloudwatch registry to get the JVM data posted to AWS CloudWatch. This is used as a maven dependency in the project.
<dependency>
   <groupId>io.micrometer</groupId>
   <artifactId>micrometer-registry-cloudwatch2</artifactId>
   <version>1.5.4</version>
</dependency>
Checkout their repository on maven -
https://mvnrepository.com/artifact/io.micrometer
Using this registry, we get the 2 most important tasks done by this dependency —
-
Creating and registering our CloudWatchMeterRegistry for AWS CloudWatch.
-
Binding our CustomJvmMetrics implementation to it so as it can send periodic data to AWS CloudWatch through the Meter Registry created in the above step.
We have registered it as @Bean in our Spring Boot application so that at application bootstrap, the registry is created and the metrics are bound to the registry for sending data periodically to AWS CloudWatch.
Here is an example of the bean created -
In our spring boot application, we are wiring up the CustomJvmMemoryMetrics Bean at startup. This bean is responsible for binding our JvmMemoryMetrics to the CloudWatchMeterRegistry.
The meter registry can hold multiple custom metrics implementations that send out data points to the CloudWatch.
Here, if you observe, we are instantiating CloudWatchMeterRegistry using the metrics configuration that we have. This registry is responsible for posting the data points to CloudWatch.
This registry is in turn needed to be added to the collection of other registries that CloudWatch Metrics functionality needs to listen to. This can be accomplished using the micrometer’s Metrics class.
The CloudWatchConfig takes the batch frequency as an input, based on which the CloudWatchMeterRegistry executes the MeterRegistry defined by us in later steps.
The third important task is creating a custom implementation for providing JVM details of the instance that the code is executing upon.
Our implementation talks about 3 main aspects of JVM details-
-
JVM memory available
-
JVM memory committed
-
JVM memory used
We specifically focused on the heap memory rather than the other types such as, Garbage Collector, Memory pool, etc. But the choice is yours- you may focus on a type of memory based on ‘what to ask for’ and ‘what needs to be sent to CloudWatch’.
How were the JVM memory data points created?
Your implementation has to implement interface MeterBinder from the micrometer. This makes you write your own implementation for bindTo method. This method is the one that sends out data points to CloudWatch Registry and in turn, to AWS CloudWatch.
In the bindTo() method, we have to check for all the instances that implement the MXBean Interface in the Java virtual machine. The below code snippet provides details of our bindTo() implementation.
CustomJvmMetrics.java
This Class is needed to extract the memory values out of memory bean.
JvmMemory.java
How does the code send data to CloudWatch?
We can create the required metric with the required names and parameters using the Gauge interface from the micrometer. So, as already mentioned earlier, every Guage is a metric that we see inside the namespaces. Every Guage is registered to the meter registry that we’ve created. Here is an example-
In this way, we will be able to send the data points to AWS CloudWatch.
Challenges we faced
The major challenge we faced was getting our code authorized to send the data points to AWS CloudWatch. Not everyone can access and send the data to AWS CloudWatch. There are some options to it -
-
When we are using IAM roles, the IAM role that the instance has while executing our code needs to have the policy CloudWatchAgentAdminPolicy attached to it. Else, it won’t be able to send the data.
-
Without IAM roles, we need to provide credentials to our code so that it can send data points to AWS CloudWatch. There are a few ways by which we can do that.
-
Use aws cli to do aws configure and provide accesskey, secretkey and region details. Once this is done, the code will pick up details from it.
-
Set accesskey and secretkey as environment variables to your server. The code will pick up from environment variables as well, if not found globally. Values to set AWS_ACCESS_KEY_ID and AWS_SECRET_ACCESS_KEY.