Explaining what the Databricks Community Cloud is and how you can leverage it
The Databricks Community Cloud is a free version of Databricks’ Cloud-based Big Data Platform for business. With this product, users can spin up micro-clusters running configurable versions of Apache Spark, create and manage Notebooks that can execute Spark code, and much more. In this post, we’ll go over some of the high-level features and provide a step-by-step example of how you can get started with Databricks to showcase some of the main features.
Why is it useful?
-
Learning about Spark
-
Testing different versions of Spark
-
Rapid Prototyping
-
Data Analysis
-
Code Repository
-
And More…
Getting Started
The first thing you’ll need to do is create an account and log in. Follow the URL below and click “Sign Up” to do so.
https://community.cloud.databricks.com/login.html
 Log in
Once you create an account and log in, you’ll see the below Home Page:
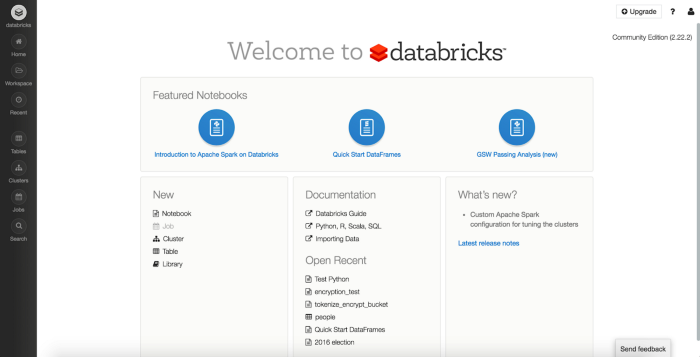 Home Page
On the left of the page, you will see a number of menu items. We’ll go over the main ones through this example. Let's start with the Cluster view:
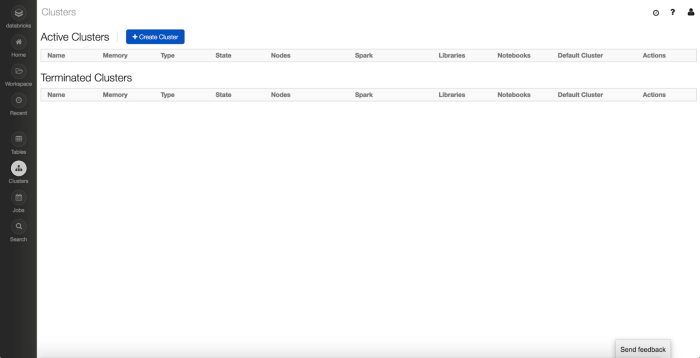 Cluster Management
This is where you can view and manage your active clusters and see the ones that have been terminated.
To create a cluster, click on the “+ Create Cluster” button at the top. Once clicked, you’ll see the following page:
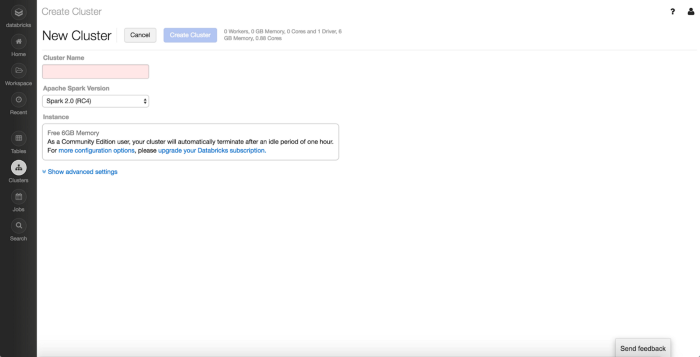 Create Cluster
Here, you’ll be prompted to provide a name for the cluster and the version of Apache Spark you want running. You can also provide advanced settings to Spark and the environment.
After providing these details, you can click “Create Cluster,” and the new cluster will start to spin up.
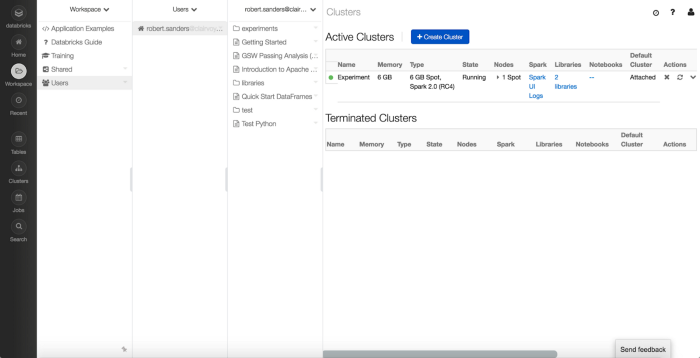
.png) Cluster Management (with a running cluster)
Cluster Management (with a running cluster)
Once the Cluster is created, you’ll see the cluster in the “Active Clusters” list.
You can then click on the cluster to view information about that cluster.
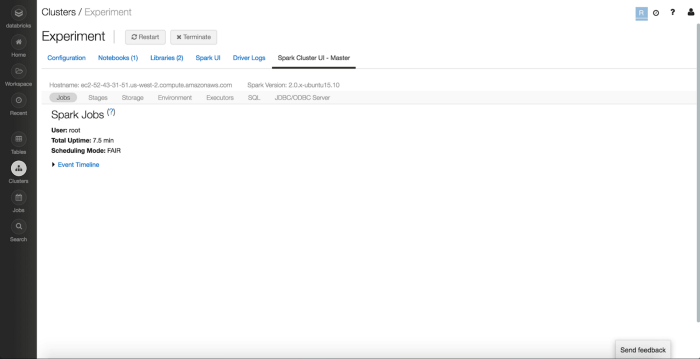 Spark Cluster UI
This also includes viewing the Spark UI, which would come in handy if you need to debug any processes or optimize execution.
The Databricks Community Cloud also includes a Notebook storage system, which you can access from the “Workspaces” menu on the top left of the screen.
 Workspaces
Here, you can access Training documents, Examples and create subdirectories to create your own Notebooks.
When you’re ready to create a Notebook, you can right-click in the directory space you want to create it in and select Create -> Notebook.
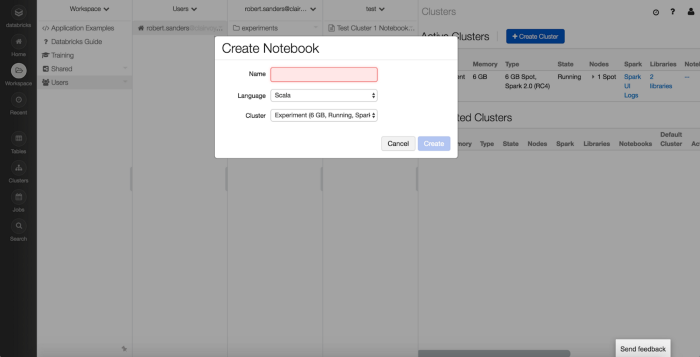 Create a Notebook
From this Create Notebook view, you just need to provide the Name of the Notebook, the Language you’d like to use (Scala, Python, SQL, R), and the Cluster with which you’d like to attach your Notebook.
Once you click “Create”, you’ll see the following view:
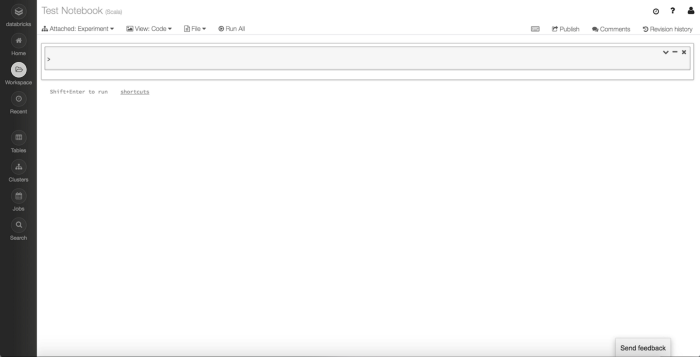 Initial Notebook View
This is the main Notebook view where you can add your code into Cells and execute that code on the Cluster you’ve attached.
.png) Initial Notebook View (breakdown)
Initial Notebook View (breakdown)
Here you can add your Spark code and execute it.
Let's do some simple spark operations to test it:
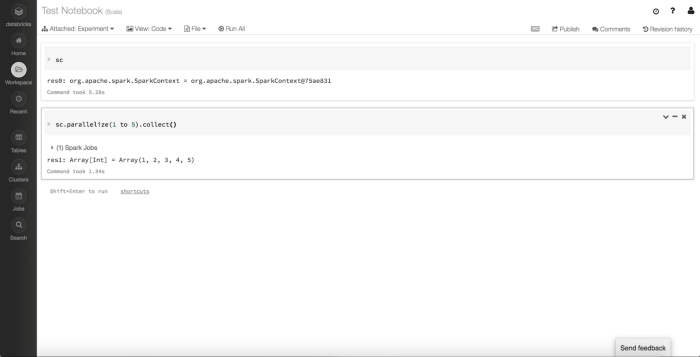 Spark Execution
Code
After entering the code above, you can either click “Run All” or run them individually with the Keyboard Shortcut Ctrl + Enter (more shortcuts listed below).
The code above simply displays the SparkContext to make sure it's available. Then, it parallelizes an array into an RDD and collects the contents to test the health of the cluster.
Keyboard Shortcuts
Shift + Enter -> Run Selected Cell and Move to next Cell
Crtl + Enter -> Run Selected Cell
Option + Enter -> Run Selected Cell and Insert Cell Below
Ctrl + Alt + p -> Create Cell Above Current Cell
Ctrl + Alt + n -> Create Cell Below Selected Cell
A very useful feature in Spark that we can also use here is Spark SQL. The Databricks Community Cloud provides an easy-to-use interface for registering tables to be used in Spark SQL. To access this interface, click on the “Tables” button on the left menu.
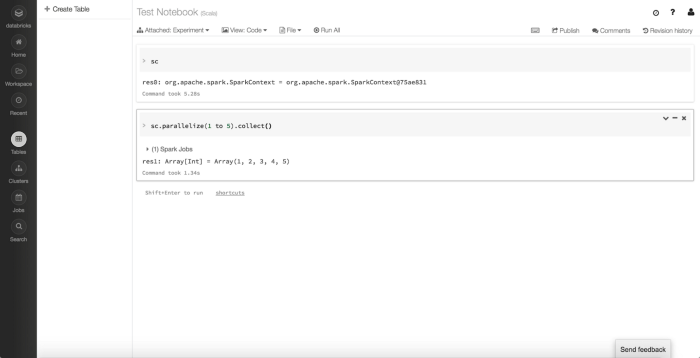 Create Table
Here, it will list all the tables that you have registered. Since we’re starting from scratch, there aren’t any tables to view. Let’s add one.
In this example, we’ll be loading CSV data from Kaggle:
https://www.kaggle.com/mylesoneill/game-of-thrones
Steps
-
From the Tables section, click “+ Create Table”
-
Select the Data Source (Note: The below steps assume you’re using File as the Data Source)
-
Upload a file from your local file system (Supported file types: CSV, JSON, Avro, Parquet)
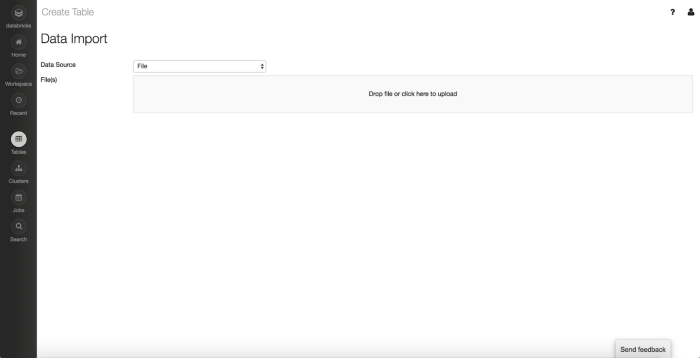 Data Import
-
Click “Preview Table”
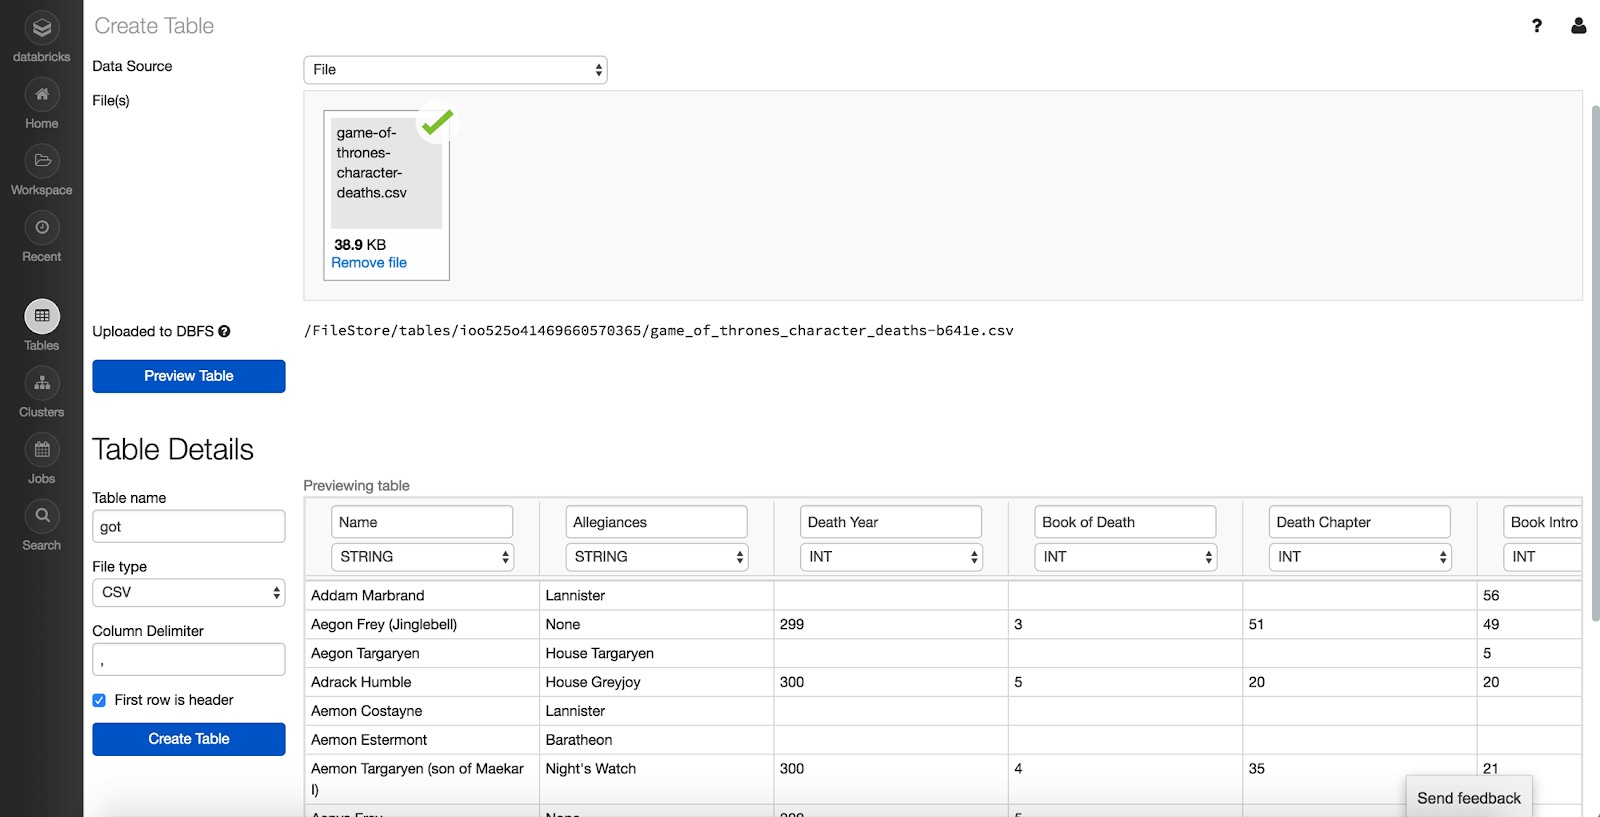 Data Preview
-
Fill in the Table Name
-
Select the File Type and other Options depending on the File Type
-
Change Column Names and Types as desired
-
Click “Create Table”
Once created, you will then be able to view the full schema:
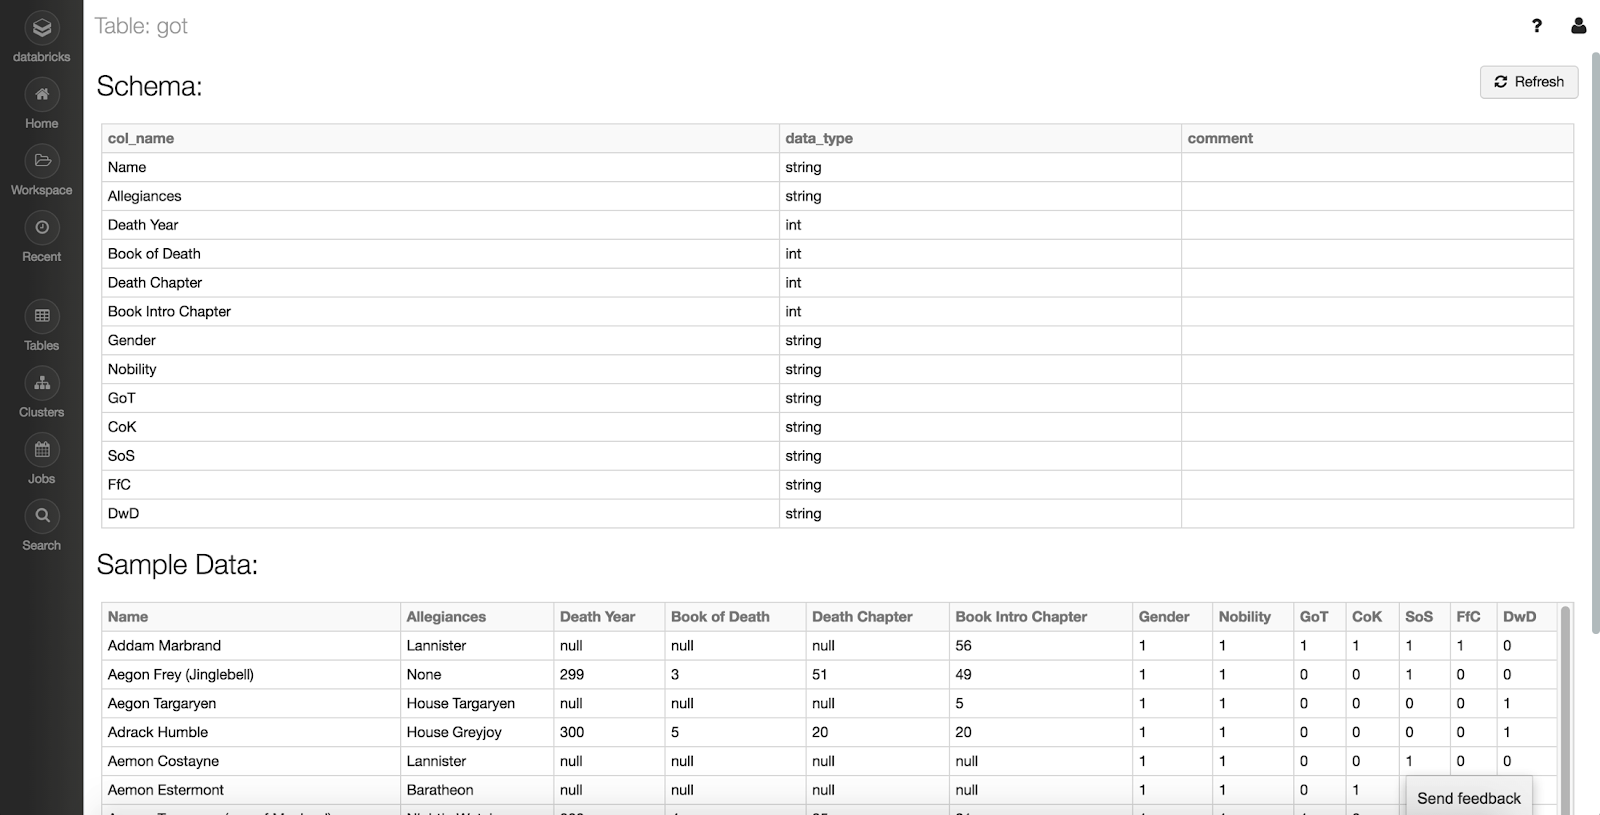 Table Schema
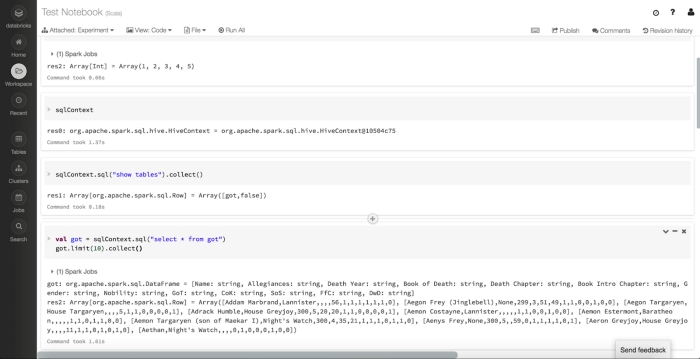
We can go back to our Notebook and use the sqlContext to access and process this data.
 Spark SQL Execution
Code
Above, we’re listing out the sqlContext to ensure it's available and then loading the newly created Table into a DataFrame named got.
A very useful feature that’s available in Databricks Community Cloud, is the display function.
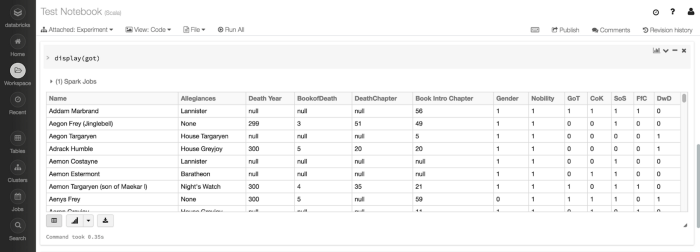 DataFrame Display
This function accepts a DataFrame. Once executed, it provides a tabular view of the data on the Notebook. There is a lot we can do with this display functionality.
First, let's clean up some of the data:
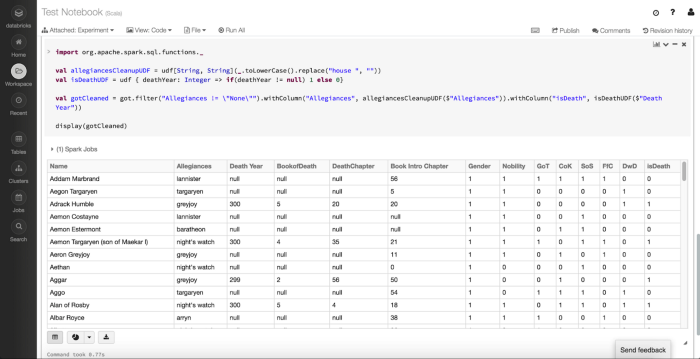 Data Cleanup
Code
The clean-up operations we’re doing above are to remove the people without Allegiances to a particular organization in the Game of Thrones universe, clean up the Allegiances field, and add a new column called isDeath.
With the display function, we can then adjust it to be a plot instead of a table. This can be done by clicking on the “Plot” icon below the graph (to the right of the “Table” icon). Here you can specify the number of different plots, such as:
-
Bar
-
Scatter
-
Map
-
Line
-
Area
-
Pie
-
Quantile
-
Histogram
-
Box plot
-
Q-Q plot
-
Pivot
For this example, let’s assume we want to visually compare how many forces each organization (or Allegiance) has lost. For that, we can select a Pie chart plot and set Allegiance as Keys and isDeath as Values from the Plot Options.
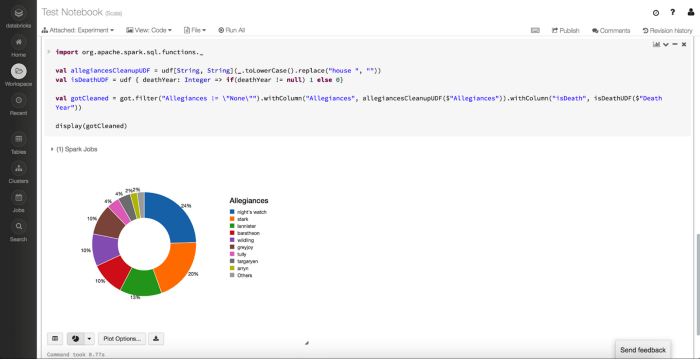 Display DataFrame
Setting those Plot Options will result in the above view. This gives us a quick way to compare and contrast the number of losses each of the organizations in Game of Thrones has incurred.
Once you’re in a state where you’d like to publish your notebook for others to view, you can do so by:
1. While in a Notebook, click “Publish” on the top right
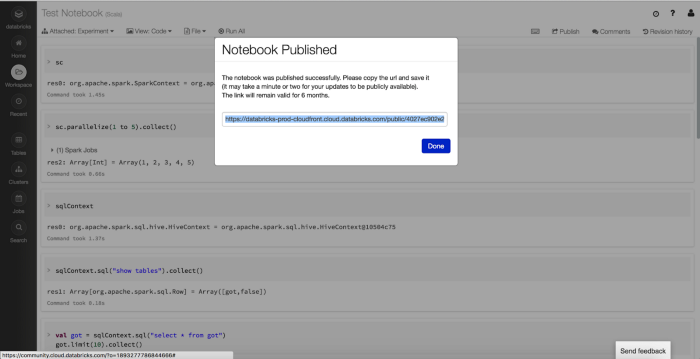 Publish Notebook
2. Click “Publish” on the pop-up
3. Copy the link and send it out
Here’s where you can visit this example: